
12.10 Trees

Learning Objectives
After completing this section, you should be able to:
- Describe and identify trees.
- Determine a spanning tree for a connected graph.
- Find the minimum spanning tree for a weighted graph.
- Solve application problems involving trees.
We saved the best for last! In this last section, we will discuss arguably the most fun kinds of graphs, trees. Have you every researched your family tree? Family trees are a perfect example of the kind of trees we study in graph theory. One of the characteristics of a family tree graph is that it never loops back around, because no one is their own grandparent!
What Is A Tree?
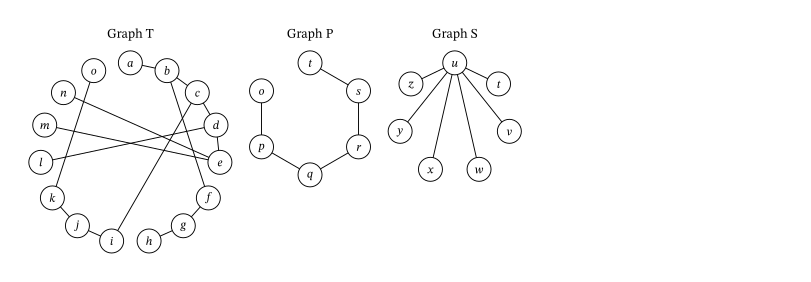
Whether we are talking about a family tree or a tree in a forest, none of the branches ever loops back around and rejoins the trunk. This means that a tree has no cyclic subgraphs, or is acyclic. A tree also has only one component. So, a tree is a connected acyclic graph. Here are some graphs that have the same characteristic. Each of the graphs in Figure 12.204 is a tree.
Let’s practice determining whether a graph is a tree. To do this, check if a graph is connected and has no cycles.
Types of Trees
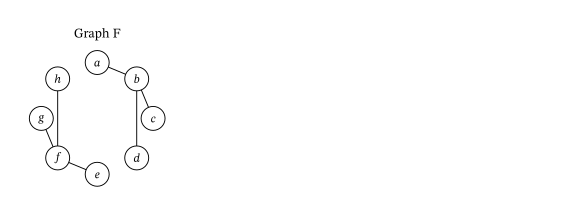
Mathematicians have had a lot of fun naming graphs that are trees or that contain trees. For example, the graph in Figure 12.206 is not a tree, but it contains two components, one containing vertices a through d, and the other containing vertices e through g, each of which would be a tree on its own. This type of structure is called a forest. There are also interesting names for trees with certain characteristics.
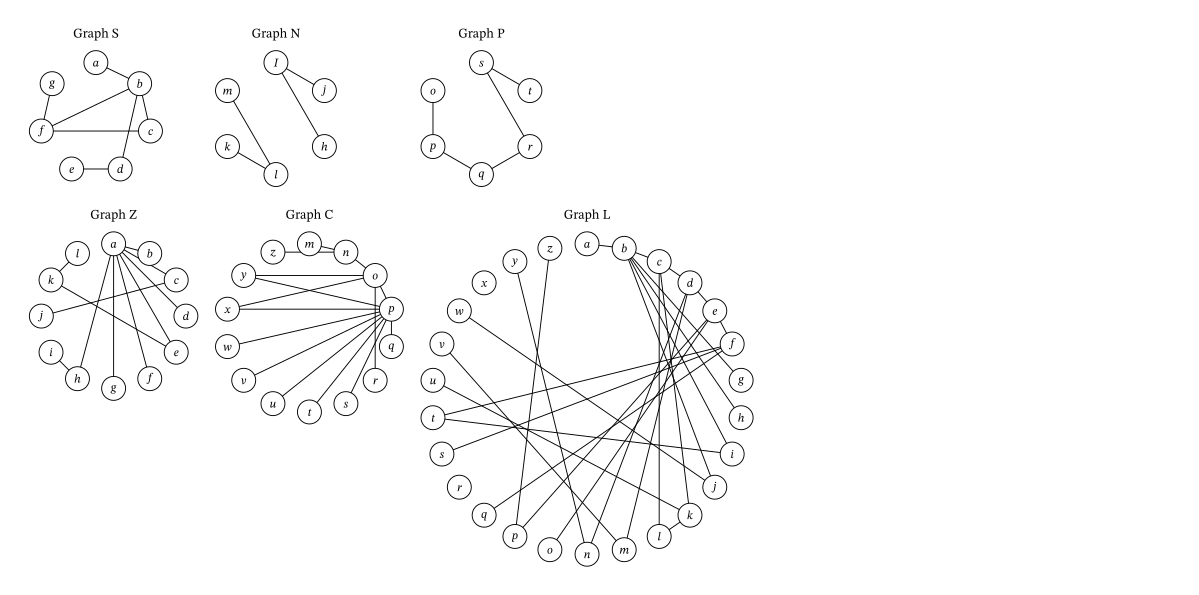
- A path graph or linear graph is a tree graph that has exactly two vertices of degree 1 such that the only other vertices form a single path between them, which means that it can be drawn as a straight line.
- A star tree is a tree that has exactly one vertex of degree greater than 1 called a root, and all other vertices are adjacent to it.
- A starlike tree is a tree that has a single root and several paths attached to it.
- A caterpillar tree is a tree that has a central path that can have vertices of any degree, with each vertex not on the central path being adjacent to a vertex on the central path and having a degree of one.
- A lobster tree is a tree that has a central path that can have vertices of any degree, with paths consisting of either one or two edges attached to the central path.
Examples of each of these types of structures are given in Figure 12.207.
Characteristics of Trees
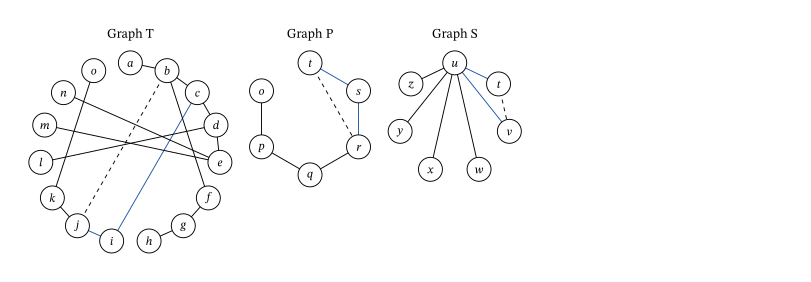
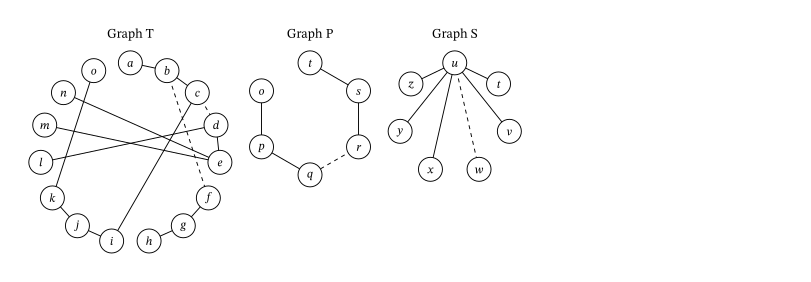
As we study trees, it is helpful to be familiar with some of their characteristics. For example, if you add an edge to a tree graph between any two existing vertices, you will create a cycle, and the resulting graph is no longer a tree. Some examples are shown in Figure 12.209. Adding edge bj to Graph T creates cycle (b, c, i, j). Adding edge rt to Graph P creates cycle (r, s, t). Adding edge tv to Graph S creates cycle (t, u, v).
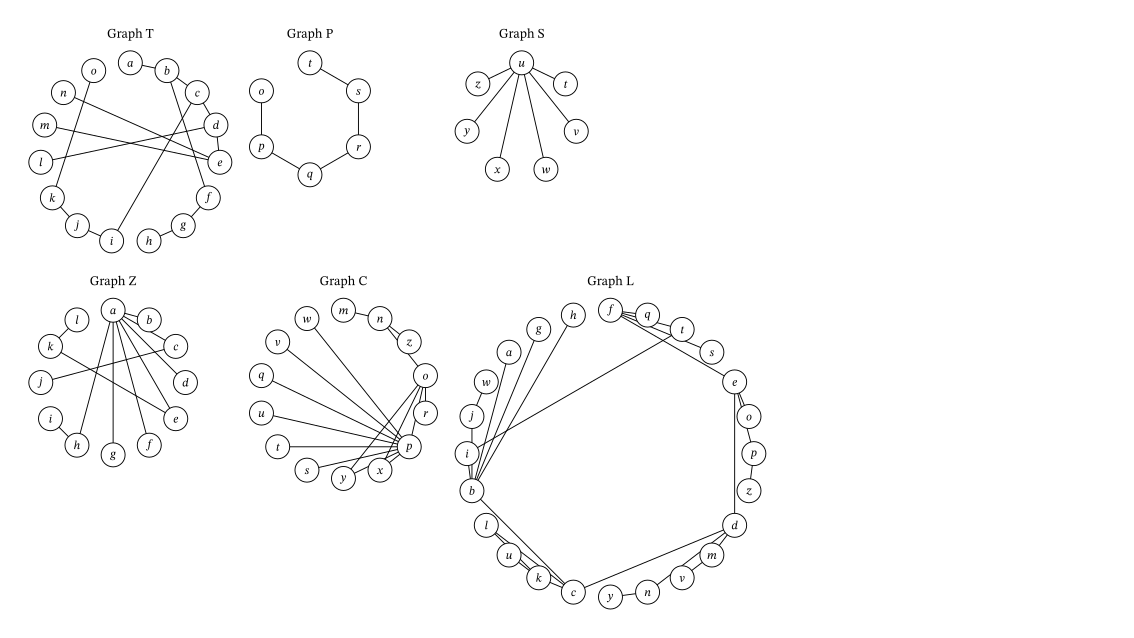
It is also true that removing an edge from a tree graph will increase the number of components and the graph will no longer be connected. In fact, you can see in Figure 12.210 that removing one or more edges can create a forest. Removing edge qr from Graph P creates a graph with two components, one with vertices o, p and q, and the other with vertices r, s, and t. Removing edge uw from Graph S creates two components, one with just vertex w and the other with the rest of the vertices. When two edges were removed from Graph T, edge bf and edge cd, creates a graph with three components as shown in Figure 12.210.
A very useful characteristic of tree graphs is that the number of edges is always one less than the number of vertices. In fact, any connected graph in which the number of edges is one less than the number of vertices is guaranteed to be a tree. Some examples are given in Figure 12.211.
Spanning Trees
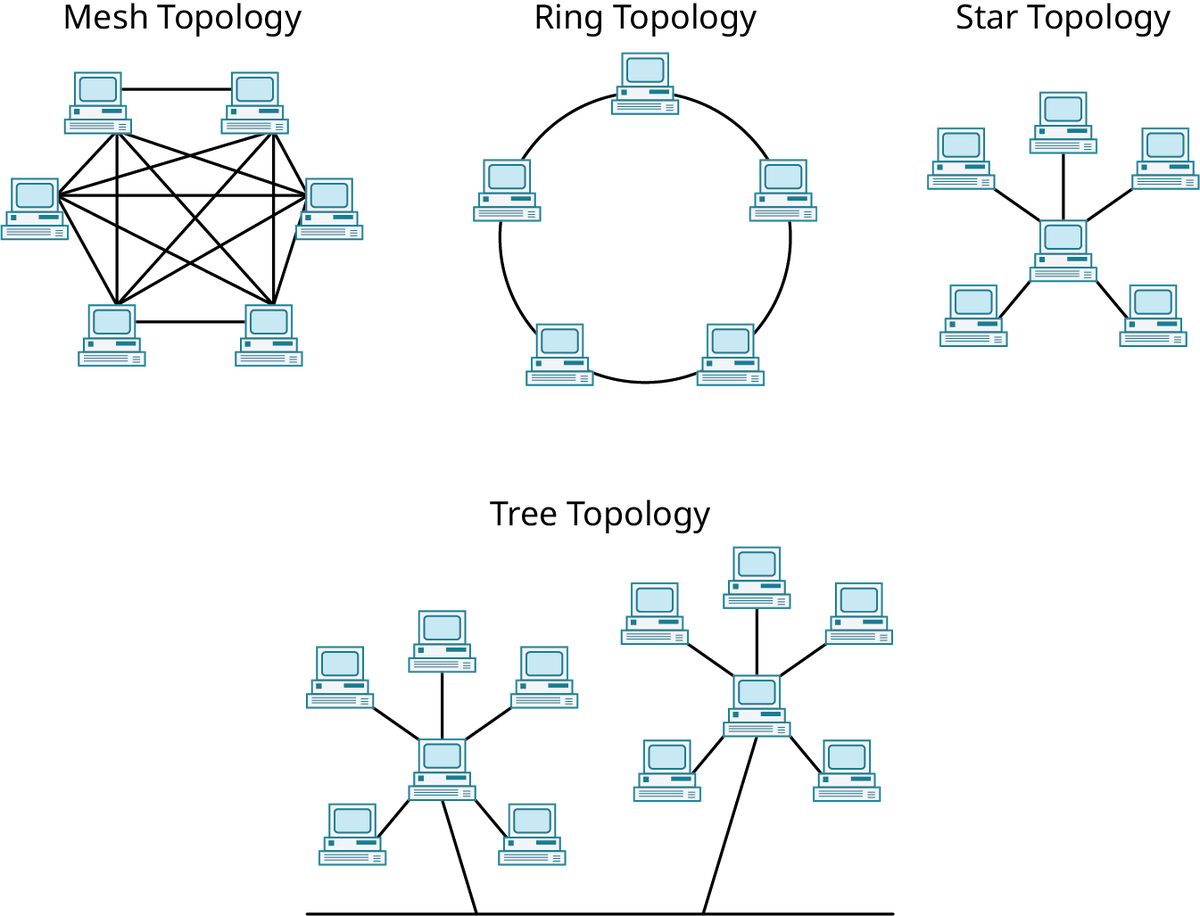
Suppose that you planned to set up your own computer network with four devices. One option is to use a “mesh topology” like the one in Figure 12.213, in which each device is connected directly to every other device in the network.
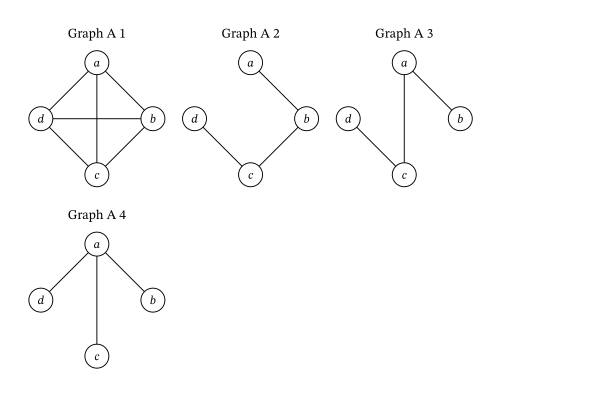
The mesh topology for four devices could be represented by the complete Graph A1 in Figure 12.214 where the vertices represent the devices, and the edges represent network connections. However, the devices could be networked using fewer connections. Graphs A2, A3, and A4 of Figure 12.214 show configurations in which three of the six edges have been removed. Each of the Graphs A2, A3 and A4 in Figure 12.214 is a tree because it is connected and contains no cycles. Since Graphs A2, A3 and A4 are also subgraphs of Graph A1 that include every vertex of the original graph, they are also known as spanning trees.
By definition, spanning trees must span the whole graph by visiting all the vertices. Since spanning trees are subgraphs, they may only have edges between vertices that were adjacent in the original graph. Since spanning trees are trees, they are connected and they are acyclic. So, when deciding whether a graph is a spanning tree, check the following characteristics:
- All vertices are included.
- No vertices are adjacent that were not adjacent in the original graph.
- The graph is connected.
- There are no cycles.
Constructing a Spanning Tree Using Paths
Suppose that you wanted to find a spanning tree within a graph. One approach is to find paths within the graph. You can start at any vertex, go any direction, and create a path through the graph stopping only when you can’t continue without backtracking as shown in Figure 12.216.

Once you have stopped, pick a vertex along the path you drew as a starting point for another path. Make sure to visit only vertices you have not visited before as shown in Figure 12.217.
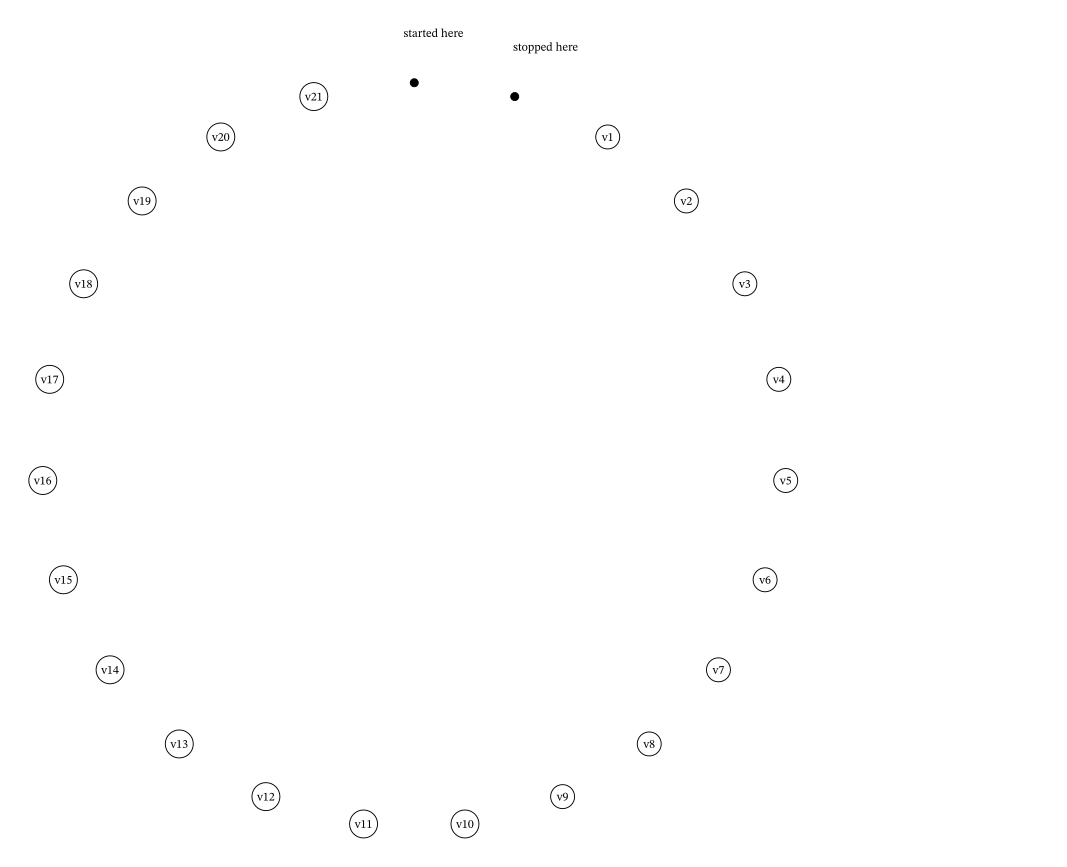
Repeat this process until all vertices have been visited as shown in Figure 12.218.

The end result is a tree that spans the entire graph as shown in Figure 12.219.
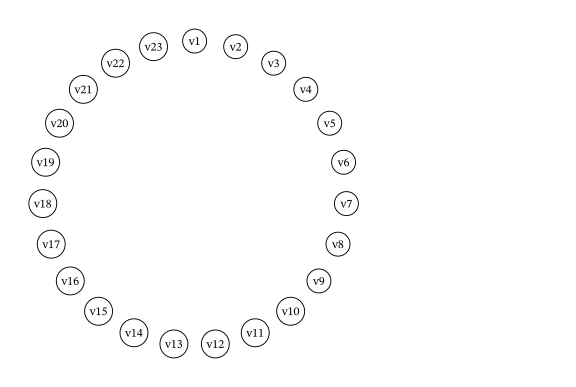
Notice that this subgraph is a tree because it is connected and acyclic. It also visits every vertex of the original graph, so it is a spanning tree. However, it is not the only spanning tree for this graph. By making different turns, we could create any number of distinct spanning trees.
Revealing Spanning Trees
Another approach to finding a spanning tree in a connected graph involves removing unwanted edges to reveal a spanning tree. Consider Graph D in Figure 12.223.
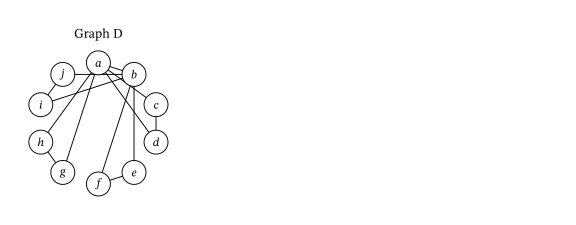
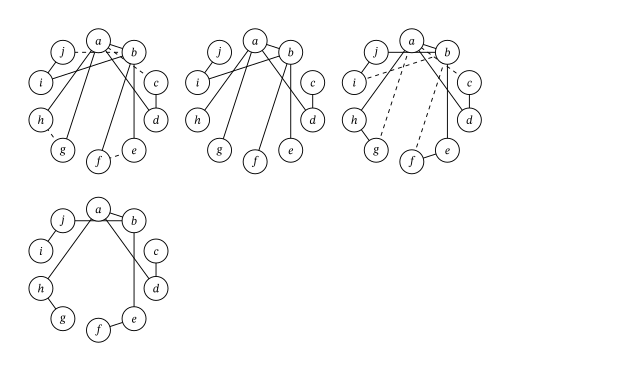
Graph D has 10 vertices. A spanning tree of Graph D must have 9 edges, because the number of edges is one less than the number of vertices in any tree. Graph D has 13 edges so 4 need to be removed. To determine which 4 edges to remove, remember that trees do not have cycles. There are four triangles in Graph D that we need to break up. We can accomplish this by removing 1 edge from each of the triangles. There are many ways this can be done. Two of these ways are shown in Figure 12.224.
Kruskal’s Algorithm
In many applications of spanning trees, the graphs are weighted and we want to find the spanning tree of least possible weight. For example, the graph might represent a computer network, and the weights might represent the cost involved in connecting two devices. So, finding a spanning tree with the lowest possible total weight, or minimum spanning tree, means saving money! The method that we will use to find a minimum spanning tree of a weighted graph is called Kruskal’s algorithm. The steps for Kruskal’s algorithm are:
Step 1: Choose any edge with the minimum weight of all edges.
Step 2: Choose another edge of minimum weight from the remaining edges. The second edge does not have to be connected to the first edge.
Step 3: Choose another edge of minimum weight from the remaining edges, but do not select any edge that creates a cycle in the subgraph you are creating.
Step 4: Repeat step 3 until all the vertices of the original graph are included and you have a spanning tree.
Key Terms
- acyclic
- tree
- forest
- path graph or linear graph
- star tree
- root
- starlike tree
- caterpillar tree
- lobster tree
- spanning tree
- minimum spanning tree
Key Concepts
- A brute force algorithm always finds the ideal solution but can be impractical whereas a greedy algorithm is efficient but usually does not lead to the ideal solution.
- A Hamilton cycle of lowest weight is a solution to the traveling salesperson problem.
- The brute force method finds a Hamilton cycle of lowest weight in a complete graph.
- The nearest neighbor method is a greedy algorithm that finds a Hamilton cycle of relatively low weight in a complete graph.
Videos
Formulas
- The number of edges in a tree graph with vertices is . A connected graph with n vertices and edges is a tree graph.
Projects
Everyone Gets a Turn! – Graph Colorings
Let’s put your knowledge of graph colorings to work! Your task is to plan a field day following these steps.
- Select between seven and ten activities for your field day. You can look online for ideas.
- Create a survey asking for the participants to select the three to five events in which they would most like to participate. Survey between seven and ten people.
- Use the results of your survey to create a graph in which each vertex represents one of the events. A pair of vertices will be adjacent if there is at least one participant who would like to participate in both events.
- Find a minimum coloring for the graph. Explain how you found it and how you know the chromatic number of the graph.
- Use your solution to part d to determine the minimum number of timeslots you must use to ensure that everyone has the opportunity to participate in their top three events.
- Find the complement of the graph you created. Explain what the edges in this graph represent.
A Beautiful Day in the Neighborhood – Euler Circuits
Let’s apply what you have learned to the community in which you live. Using resources such as your county’s property appraiser’s website, create a detailed graph of your neighborhood in which vertices represent turns and intersections. Represent a large enough part of your community to include no fewer than 10 intersections or turns. Then use your graph to answer the following questions.
- Label the edges of your graph.
- Determine if your graph is Eulerian. Explain how you know. If it is not, eulerize it.
- Find an Euler circuit for your graph. Give the sequence of vertices that you found.
- What does the Euler circuit you found in part c represent for your community?
- Describe an application for which this Euler circuit might be used.
Dream Vacation – Hamilton Cycles and Paths
Where in the world would you like to travel most: the Eiffel Tower in Paris, a Broadway musical in New York city, a bike tour of Amsterdam, the Tenerife whale and dolphin cruises in the Canary Islands, the Giza Pyramid in Cairo, or maybe the Jokhang Temple in Tibet? Let's plan your dream vacation!
- Which four destinations are at the top of your bucket list?
- Draw a complete weighted graph with five vertices representing the four destinations and your home city, and the weights representing the cost of travel between cities.
- Use a website (such as Travelocity) to find the best airfare between each pair of cities. List the airlines and flight numbers along with the prices. Include cost for ground transportation from the nearest airport if there is no airport at the destination you want to visit.
- Use the nearest neighbor algorithm to find a Hamilton cycle of low weight beginning and ending in your hometown. What is the weight of this circuit and what does it represent?
- Use the brute force method to find a Hamilton cycle of lowest weight beginning and ending in your hometown. What is the weight of this circuit? Is it the same or different from the weight of the Hamilton cycle you found in Exercise 4?
- Suppose that instead of returning home, you planned to move to your favorite location on the list, but you wanted to stop at the other three destinations once along the way. Where would you move? List all Hamilton paths between your hometown and your favorite location.
- Find the weights of all the Hamilton paths you found in Exercise 6.
Adapted from Contemporary Mathematics by OpenStax (openstax.org), licensed under CC BY-NC-SA 4.0. Changes were made. License: CC-BY-NC-SA-4.0.