
13.3 Math and Medicine
Learning Objectives
After completing this section, you should be able to:
- Compute the mathematical factors utilized in concentrations/dosages of drugs.
- Describe the history of validating effectiveness of a new drug.
- Describe how mathematical modeling is used to track the spread of a virus.
The pandemic that rocked the world starting in 2020 turned attention to finding a cure for the Covid-19 strain into a world race and dominated conversations from major news channels to households around the globe. News reports decreeing the number of new cases and deaths locally as well as around the world were part of the daily news for over a year and progress on vaccines soon followed. How was a vaccine able to be found so quickly? Is the vaccine safe? Is the vaccine effective? These and other questions have been raised through communities near and far and some remain debatable. However, we can educate ourselves on the foundations of these discussions and be more equipped to analyze new information related to these questions as it becomes available.
Concentrations and Dosages of Drugs
Consider any drug and the recommended dosage varies based on several factors such as age, weight, and degree of illness of a person. Hospitals and medical dispensaries do not stock every possible needed concentration of medicines. Drugs that are delivered in liquid form for intravenous (IV) methods in particular can be easily adjusted to meet the needs of a patient. Whether administering anesthesia prior to an operation or administering a vaccine, calculation of the concentration of a drug is needed to ensure the desired amount of medicine is delivered.
The formula to determine the volume needed of a drug in liquid form is a relatively simple formula. The volume needed is calculated based on the required dosage of the drug with respect to the concentration of the drug. For drugs in liquid form, the concentration is noted as the amount of the drug per the volume of the solution that the drug is suspended in which is commonly measured in g/mL or mg/mL.
Suppose a doctor writes a prescription for 6 mg of a drug, which a nurse calculates when retrieving the needed prescription from their secure pharmaceutical storage space. On the shelves, the drug is available in liquid form as 2 mg per mL. This means that 1 mg of the drug is found in 0.5 mL of the solution. Multiplying 6 mg by 0.5 mL yields 3 mL, which is the volume of the prescription per single dose.
A common calculation for the weight of a liquid drug is measured in grams of a drug per 100 mL of solution and is also called the percentage weight by volume measurement and labeled as % w/v or simply w/v.
Suppose you visit your doctor with symptoms of an upset stomach and unrelenting heartburn. One possible recourse is sodium bicarbonate, which aids in reducing stomach acid.
Validating Effectiveness of a New Vaccine
The process to develop a new vaccine and be able to offer it to the public typically takes 10 to 15 years. In the United States, the system typically involves both public and private participation in a process. During the 1900s, several vaccines were successfully developed, including the following: polio vaccine in the 1950s and chickenpox vaccine in the 1990s. Both of these vaccines took years to be developed, tested, and available to the public. Knowing the typical timeline for a vaccine to move from development to administration, it is not surprising that some people wondered how a vaccine for Covid-19 was released in less than a year’s time.
Lesser known is that research on coronavirus vaccines has been in process for approximately 10 years. Back in 2012, concern over the Middle Eastern respiratory syndrome (MERS) broke out and scientists from all over the world began working on researching coronaviruses and how to combat them. It was discovered that the foundation for the virus is a spike protein, which, when delivered as part of a vaccine, causes the human body to generate antibodies and is the platform for coronavirus vaccines.
When the Covid-19 pandemic broke out, Operation Warp Speed, fueled by the U.S. federal government and private sector, poured unprecedented human resources into applying the previous 10 years of research and development into targeting a specific vaccine for the Covid-19 strain.
Mathematical Modeling to Track the Spread of a Vaccine
With a large number of people receiving a Covid-19 vaccine, the concern at this time is how to create an affordable vaccine to reach people all over the world. If a world solution is not found, those without access to a vaccine will serve as incubators to variants that might be resistant to the existing vaccines.
As we work to vaccinate the world, attention continues with tracking the spread of the Covid-19 and its multiple variants. Mathematical modeling is the process of creating a representation of the behavior of a system using mathematical language. Digital mathematical modeling plays a key role in analyzing the vast amounts of data reported from a variety of sources such as hospitals and apps on cell phones.
When attempting to represent an observed quantitative data set, mathematical models can aid in finding patterns and concentrations as well as aid in predicting growth or decline of the system. Mathematical models can also be useful to determine strengths and vulnerabilities of a system, which can be helpful in arresting the spread of a virus.
The chapter on Graph Theory explores one such method of mathematical modeling using paths and circuits. Cell phones have been helpful in tracking the spread of the Covid-19 virus using apps regulated by regional government public health authorities to collect data on the network of people exposed to an individual who tests positive for the Covid-19 virus.
Consider the following graph (Figure 13.11):
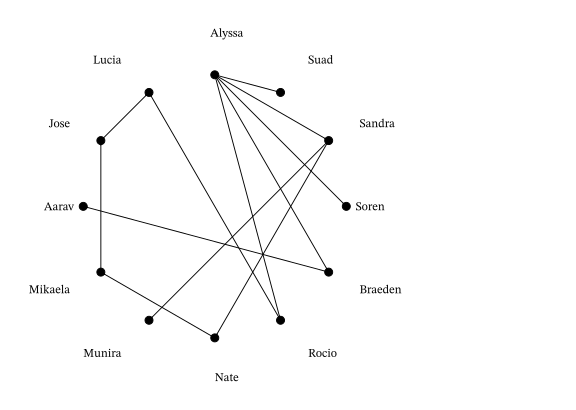
At the center of the graph, we find Alyssa, whom we will consider positive for a virus. Utilizing the technology of phone apps voluntarily installed on each phone of the individuals in the graph, tracking of the spread of the virus among the 6 individuals that Alyssa had direct contact with can be implemented, namely Suad, Rocio, Braeden, Soren, and Sandra.
Let’s look at José’s exposure risk as it relates to Alyssa. There are multiple paths connecting José with Alyssa. One path includes the following individuals: José to Mikaela to Nate to Sandra to Alyssa. This path contains a length of 4 units, or people, in the contact tracing line. There are 2 more paths connecting José to Alyssa. A second path of the same length consists of José to Lucia to Rocio to Braeden to Alyssa. Path 3 is the shortest and consists of José to Lucia to Rocio to Alyssa. Tracking the spread of positive cases in the line between Alyssa and José aids in monitoring the spread of the infection.
Now consider the complexity of tracking a pandemic across the nation. Graphs such as the one above are not practical to be drawn on paper but can be managed by computer programs capable of computing large volumes of data. In fact, a computer-generated mathematical model of contact tracing would look more like a sphere with paths on the exterior as well as on the interior. Mathematical modeling of contact tracing is complex and feasible through the use of technology.
Key Terms
- concentrations/dosages of drugs
- mathematical modeling
Key Concepts
- Compute volumes of prescription drugs in liquid and pill form.
- Validate the effectiveness of a new drug.
- Mathematical modeling can be used to describe and track the spread of a virus.
Formula
.
Adapted from Contemporary Mathematics by OpenStax (openstax.org), licensed under CC BY-NC-SA 4.0. Changes were made. License: CC-BY-NC-SA-4.0.