
1.3 Understanding Venn Diagrams

Learning Objectives
After completing this section, you should be able to:
- Utilize a universal set with two sets to interpret a Venn diagram.
- Utilize a universal set with two sets to create a Venn diagram.
- Determine the complement of a set.
Have you ever ordered a new dresser or bookcase that required assembly? When your package arrives you excitedly open it and spread out the pieces. Then you check the assembly guide and verify that you have all the parts required to assemble your new dresser. Now, the work begins. Luckily for you, the assembly guide includes step-by-step instructions with images that show you how to put together your product. If you are really lucky, the manufacturer may even provide a URL or QR code connecting you to an online video that demonstrates the complete assembly process. We can likely all agree that assembly instructions are much easier to follow when they include images or videos, rather than just written directions. The same goes for the relationships between sets.
Interpreting Venn Diagrams
Venn diagrams are the graphical tools or pictures that we use to visualize and understand relationships between sets. Venn diagrams are named after the mathematician John Venn, who first popularized their use in the 1880s. When we use a Venn diagram to visualize the relationships between sets, the entire set of data under consideration is drawn as a rectangle, and subsets of this set are drawn as circles completely contained within the rectangle. The entire set of data under consideration is known as the universal set.
Consider the statement: All trees are plants. This statement expresses the relationship between the set of all plants and the set of all trees. Because every tree is a plant, the set of trees is a subset of the set of plants. To represent this relationship using a Venn diagram, the set of plants will be our universal set and the set of trees will be the subset. Recall that this relationship is expressed symbolically as: To create a Venn diagram, first we draw a rectangle and label the universal set “” Then we draw a circle within the universal set and label it with the word “Trees.”
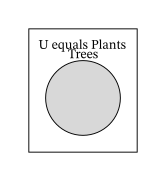
This section will introduce how to interpret and construct Venn diagrams. In future sections, as we expand our knowledge of relationships between sets, we will also develop our knowledge and use of Venn diagrams to explore how multiple sets can be combined to form new sets.
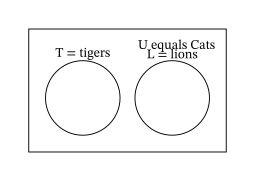
So far, the only relationship we have been considering between two sets is the subset relationship, but sets can be related in other ways. Lions and tigers are both different types of cats, but no lions are tigers, and no tigers are lions. Because the set of all lions and the set of all tigers do not have any members in common, we call these two sets disjoint sets, or non-overlapping sets.
Two sets and are disjoint sets if they do not share any elements in common. That is, if is a member of set , then is not a member of set . If is a member of set , then is not a member of set . To represent the relationship between the set of all cats and the sets of lions and tigers using a Venn diagram, we draw the universal set of cats as a rectangle and then draw a circle for the set of lions and a separate circle for the set of tigers within the rectangle, ensuring that the two circles representing the set of lions and the set of tigers do not touch or overlap in any way.
Creating Venn Diagrams
The main purpose of a Venn diagram is to help you visualize the relationship between sets. As such, it is necessary to be able to draw Venn diagrams from a written or symbolic description of the relationship between sets.
Procedure
To create a Venn diagram:
- Draw a rectangle to represent the universal set, and label it .
- Draw a circle within the rectangle to represent a subset of the universal set and label it with the set name.
The Complement of a Set
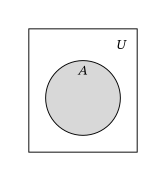
Recall that if set is a proper subset of set , the universal set (written symbolically as ), then there is at least one element in set that is not in set . The set of all the elements in the universal set that are not in the subset is called the complement of set , . In set builder notation this is written symbolically as: The symbol is used to represent the phrase, “is a member of,” and the symbol is used to represent the phrase, “is not a member of.” In the Venn diagram below, the complement of set is the region that lies outside the circle and inside the rectangle. The universal set includes all of the elements in set and all of the elements in the complement of set , and nothing else.
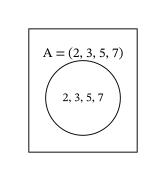
Consider the set of digit numbers. Let this be our universal set, Now, let set be the subset of consisting of all the prime numbers in set , The complement of set is The following Venn diagram represents this relationship graphically.
Key Terms
- Venn diagram
- universal set
- disjoint set
- complement of a set
Key Concepts
- A Venn diagram is a graphical representation of the relationship between sets.
- In a Venn diagram, the universal set, is the largest set under consideration and is drawn as a rectangle. All subsets of the universal set are drawn as circles within this rectangle.
- The complement of set includes all the members of the universal set that are not in set . A set and its complement are disjoint sets, they do not share any elements in common.
- To find the complement of set remove all the elements of set from the universal set , the set that includes only the remaining elements is the complement of set , .
- Determine the complement of a set using Venn diagrams, the roster method and set builder notation.
Adapted from Contemporary Mathematics by OpenStax (openstax.org), licensed under CC BY-NC-SA 4.0. Changes were made. License: CC-BY-NC-SA-4.0.