
11.6 Regression
We use the statistics features to plot data and calculate regression equations. Press STAT to see the Statistics menus. We will use only the first two, EDIT and CALC.
Making a Scatterplot
-
Press
STATENTERto access the list editor. -
Enter the -coordinates of the data points under L1 and the -coordinates in L2. An example is shown in Figurea. (If there is a previous list under L1 or L2, move the cursor up to L1 or L2 and press
CLEARENTER.)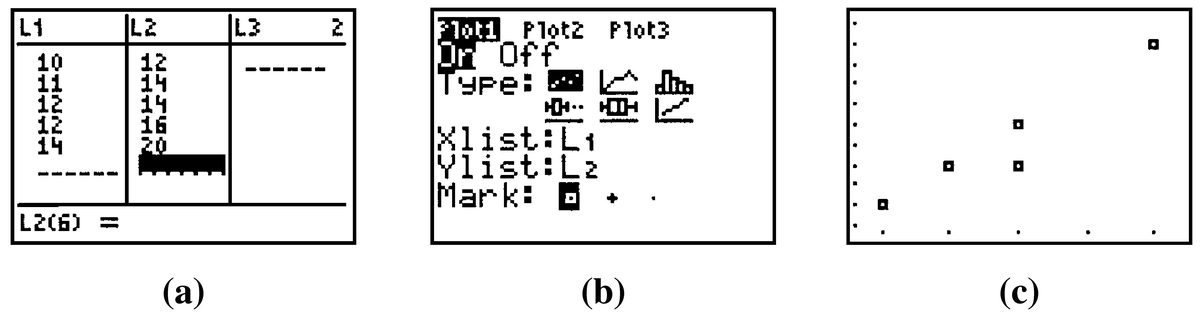
-
Access the STAT PLOT menu by pressing
2ndY=, select and turn on Plot1 by pressingENTERENTER, and set the menu options as shown in Figureb. -
Clear out any old equations from the
Y=menu, then pressZOOM(ZoomStat) to see the scatterplot.
Note: You can use any of the lists L1–L6 to store the data. Change Xlist and Ylist to reflect the appropriate lists.
Finding a Regression Equation
- Enter the data as in steps 1 and 2 of Making a Scatterplot.
-
Press
STATto open the Calculate menu, and select the type of regression equation you want. -
Press
ENTERand the calculator will display the parameters of the regression equation. See the example in Figure. (You may also see information about and .)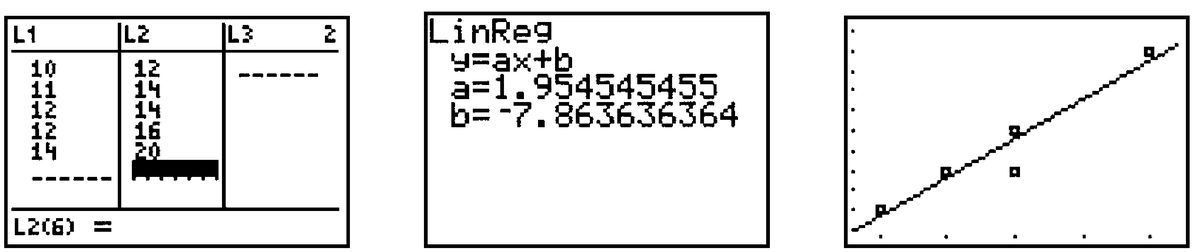
Note: If you do not use L1 and L2 to store the data, enter the appropriate lists, separated by a comma, after the regression command.
Graphing the Regression Equation
If you would like to graph the regression equation on top of the scatterplot, first follow the steps in Making a Scatterplot and Finding a Regression Equation above.
-
Press
Y=and clear out any old equations. - Position the cursor after .
-
Press
VARSENTERto copy the regression equation. -
Press
GRAPHto see graph of the regression equation and the scatterplot.
Modeling, Functions, and Graphs by Katherine Yoshiwara (yoshiwarabooks.org), GNU Free Documentation License 1.2 or later. Adapted for the XYZ HTML edition with the authors' permission (recorded 2026-07-04). License: GFDL-1.2-or-later.