We next consider another important family of functions, called exponential functions. These functions describe growth by a constant factor in equal time periods. Exponential functions model many familiar processes, including the growth of populations, compound interest, and radioactive decay. Here is an example.
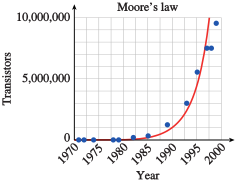
In 1965, Gordon Moore, the cofounder of Intel, observed that the number of transistors on a computer chip had doubled every year since the integrated circuit was invented. Moore predicted that the pace would slow down a bit, but the number of transistors would continue to double every 2 years. More recently, data density has doubled approximately every 18 months, and this is the current definition of Moore's law. Most experts, including Moore himself, expected Moore's law to hold for at least another two decades.
Year
Name of circuit
Transistors
Pentium
Pentium Pro
Pentium II
Pentium II Xeon
Pentium III
The data shown are modeled by the exponential function
, where is the number of years since .
Modeling, Functions, and Graphs by Katherine Yoshiwara (yoshiwarabooks.org), GNU Free Documentation License 1.2 or later. Adapted for the XYZ HTML edition with the authors' permission (recorded 2026-07-04). License: GFDL-1.2-or-later.
These eBooks are a prerelease and are not yet certified conformant with WCAG 2.1 AA or ADA Title II. Every page is built against an automated accessibility gate, and the published editions will meet ADA Title II requirements when they release in late September 2026. If something is unusable, please tell us.