
4.2 Exponential Functions
Introduction
In Exponential Growth and Decay, we studied functions that describe exponential growth or decay. More formally, we define an exponential function as follows.
Some examples of exponential functions are
The constant is the -intercept of the graph because
For the examples above, we find that the -intercepts are
The positive constant is called the base of the exponential function.
Which of the following is an exponential function?
_____
Which of the following is an exponential function?
Graphs of Exponential Functions
The graphs of exponential functions have two characteristic shapes, depending on whether the base, , is greater than or less than . As typical examples, consider the graphs of and shown below. Some values for and are recorded in the tables.
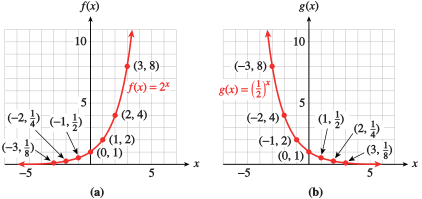
Notice that is an increasing function and is a decreasing function. Both are concave up. In general, exponential functions have the following properties.
In the table for , you can see that as the -values decrease toward negative infinity, the corresponding -values decrease toward zero. As a result, the graph of decreases toward the -axis as we move to the left. Thus, the negative -axis is a horizontal asymptote for exponential functions with , as shown in figure (a).
For exponential functions with , the positive -axis is an asymptote, as illustrated in figure (b). (See Some Basic Functions to review asymptotes.)
Which statement is true?
_____
The outputs of an exponential function cannot be negative.
Which statement is true?
- An exponential function is not defined for negative inputs.
- The outputs of an exponential function cannot be negative.
- The -intercept of the function is .
- The function decreases by each time we increase by .
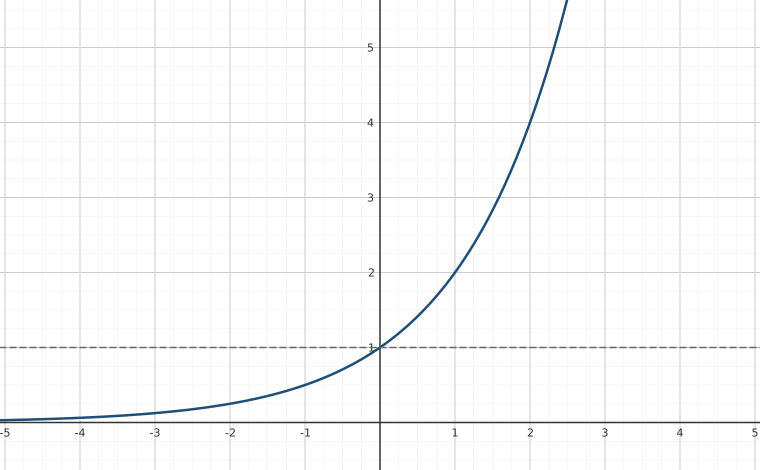
In Example, we compare two increasing exponential functions. The larger the value of the base, , the faster the function grows. In this example, both functions have .
- State the ranges of the functions and from the previous Example on the domain .
_____
_____ - State the ranges of the functions and shown in the Note above on the domain . Round your answers to two decimal places.
_____
_____
- ;
- ;
- State the ranges of the functions and from the previous Example on the domain .
- State the ranges of the functions and shown in the Note above on the domain . Round your answers to two decimal places.
- ;
- ;
Transformations of Exponential Functions
In Modeling with Functions, we considered transformations of the basic graphs. For instance, the graphs of the functions and are shifts of the basic parabola, . In a similar way, we can shift or stretch the graph of an exponential function while the basic shape is preserved.
Which function translates the graph of two units to the right?
_____
Which function translates the graph of two units to the right?
What about reflections? Recall that the graph of is the reflection about the -axis of the graph of . The graphs of and are shown at left below.
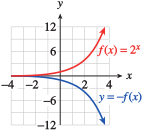
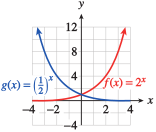
You may have also noticed a relationship between the graphs of and , which are shown at right above. The graph of is the reflection of the graph of about the -axis. We can see why this is true by writing the formula for in another way:
We see that is the same function as . Replacing by in the formula for a function switches every point on the graph with the point and thus reflects the graph about the -axis.
Which of the functions below have the same graph? Explain why.
_____
(a) and (c) are the same function.
Which of the functions below have the same graph? Explain why.
(a) and (c) are the same function.
How are the graphs of and related?
_____
How are the graphs of and related?
Comparing Exponential and Power Functions
Exponential functions are not the same as the power functions we studied in Power Functions. Although both involve expressions with exponents, it is the location of the variable that makes the difference.
These two families of functions have very different properties, as well.
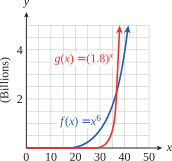
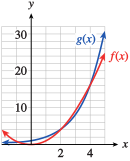
The relationship in Example holds true for all increasing power and exponential functions: For large enough values of , the exponential function will always be greater than the power function, regardless of the parameters in the functions. The figure at left shows the graphs of and . At first, , but at around , overtakes , and for all .
Which function grows fastest in the long run?
_____
Which function grows fastest in the long run?
Which of the following functions are exponential functions, and which are power functions?
- _____
- _____
- _____
- _____
Exponential: (a) and (c); power: (b) and (d)
Which of the following functions are exponential functions, and which are power functions?
Exponential: (a) and (c); power: (b) and (d)
Discuss the differences between a power function and an exponential function.
_____
Discuss the differences between a power function and an exponential function.
Exponential Equations
An exponential equation is one in which the variable is part of an exponent. For example, the equation
is exponential.
Many exponential equations can be solved by writing both sides of the equation as powers with the same base. To solve the equation above, we write
which is true if and only if .
In general, if two equivalent powers have the same base, then their exponents must be equal also, as long as the base is not or .
Sometimes the laws of exponents can be used to express both sides of an equation as single powers of a common base.
Which is a good strategy for solving ?
_____
Write the right side as a power of 3.
Which is a good strategy for solving ?
- Divide both sides by 3.
- Add to both sides.
- Simplify the left side.
- Write the right side as a power of 3.
Solve the equation .
_____
Solve the equation .
Write each side as a power of 2, then equate exponents to find
Exponential equations arise frequently in the study of exponential growth.
During an advertising campaign in a large city, the makers of Chip-O's corn chips estimate that the number of people who have heard of Chip-O's increases by a factor of every 4 days.
- If 100 people are given trial bags of Chip-O's to start the campaign, write a function, , for the number of people who have heard of Chip-O's after days of advertising.
_____ - Use your calculator to graph the function on the domain .
- How many days should the makers run the campaign in order for Chip-O's to be familiar to people? Use algebraic methods to find your answer and verify on your graph.
Answer: _____ days
- A graph is below.
- 12 days
A graph for part (b):
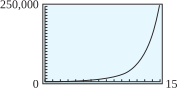
During an advertising campaign in a large city, the makers of Chip-O's corn chips estimate that the number of people who have heard of Chip-O's increases by a factor of every 4 days.
- If 100 people are given trial bags of Chip-O's to start the campaign, write a function, , for the number of people who have heard of Chip-O's after days of advertising.
- Use your calculator to graph the function on the domain .
- How many days should the makers run the campaign in order for Chip-O's to be familiar to people? Use algebraic methods to find your answer and verify on your graph.
- 12 days
Suppose is an exponential function, with and . What is ?
_____
27
Suppose is an exponential function, with and . What is ?
Use the graph of to find an approximate solution to , accurate to two decimal places.
Answer: _____
The point on the graph where has
Use the graph of to find an approximate solution to , accurate to two decimal places.
The point on the graph where has
Give an example of an exponential equation, and describe how to solve it.
_____
Give an example of an exponential equation, and describe how to solve it.
Section Summary
Vocabulary
Look up the definitions of new terms in the Glossary.
- Exponential function
- Base
- Exponential equation
CONCEPTS
- An exponential function has the form
- Quantities that increase or decrease by a constant percent in each time period grow or decay exponentially.
- The graphs of exponential functions can be transformed by shifts, stretches, and reflections.
- Exponential functions have different properties than power functions .
- We can solve some exponential equations by writing both sides with the same base and equating the exponents.
- We can use graphs to find approximate solutions to exponential equations.
STUDY QUESTIONS
- Give the general form for an exponential function. What restrictions do we place on the base of the function?
- Explain why the output of an exponential function is always positive, even if is negative.
- How are the graphs of the functions and related?
- How is an exponential function different from a power function?
- Delbert says that is equivalent to . Convince him that he is mistaken.
- Explain the algebraic technique for solving exponential equations described in this section.
SKILLS
Practice each skill in the Homework problems listed.
- Describe the graph of an exponential function: #1–14
- Graph transformations of exponential functions: #15–18, 53–60
- Evaluate exponential functions: #19–22
- Find the equation of an exponential function from its graph: #23–26
- Solve exponential equations: #27–44
- Distinguish between power and exponential functions: #45–52, 65, and 66
Homework 4.2
For Problems 1 and 2, find the -intercept of each exponential function and decide whether the graph is increasing or decreasing.
- ; increasing
- ; decreasing
- ; decreasing
- ; increasing
For Problems 3–6, make a table of values and graph each pair of functions by hand on the domain . Describe the similarities and differences between the two graphs.
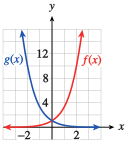
The two graphs are reflections of each other across the -axis. is increasing, is decreasing. has the negative -axis as an asymptote, and has the positive -axis as its asymptote.
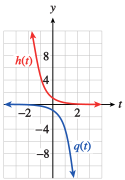
The graphs are reflections of each other across the origin. Both are decreasing, but has the negative -axis as an asymptote, and has the positive t-axis as its asymptote.
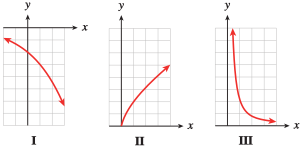
For Problems 7–12, match each function with its graph.
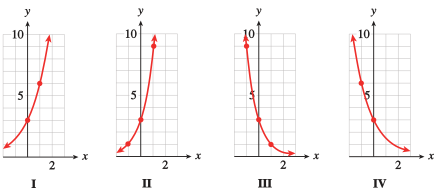
- I
- IV
- III
- II
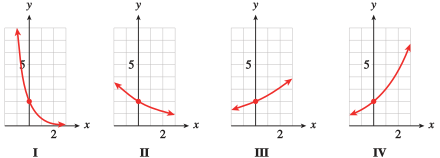
For Problems 9–12,
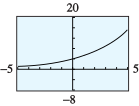
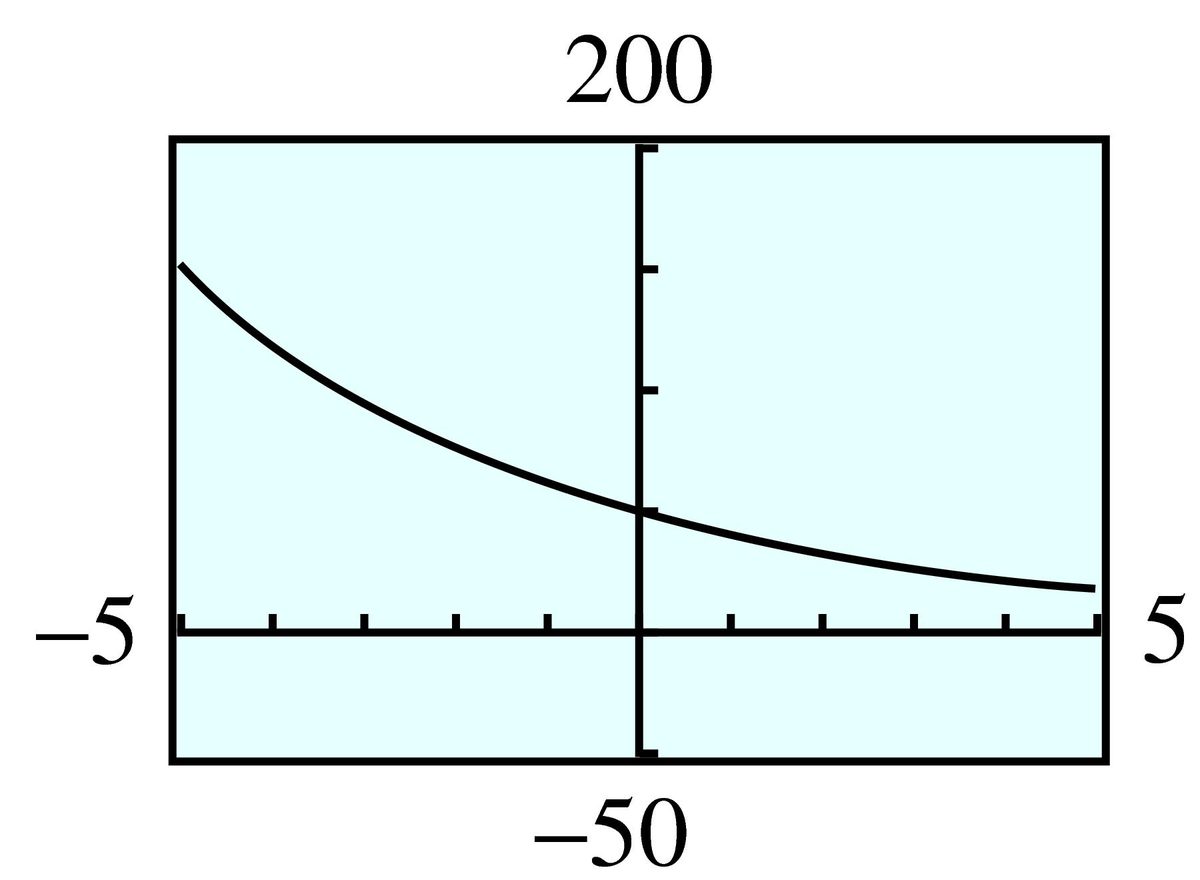
- Use a graphing calculator to graph the functions on the domain .
- Give the range of the function on that domain, accurate to hundredths.
For Problems 13 and 14, in each group of functions, which have identical graphs? Explain why.
Because they are defined by equivalent expressions, (b), (c), and (d) have identical graphs
For Problems 15–18,
- Use the order of operations to explain why the two functions are different.
- Complete the table of values and graph both functions in the same window.
- Describe each as a transformation of or .
,
- To evaluate we subtract from the input before evaluating the exponential function; to evaluate we subtract from the output of the exponential function.
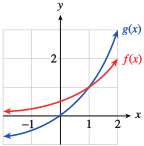
- The graph of is translated unit to the right; the graph of is shifted unit down.
,
,
- To evaluate we take the negative of the output of the exponential function; to evaluate we take the negative of the input.
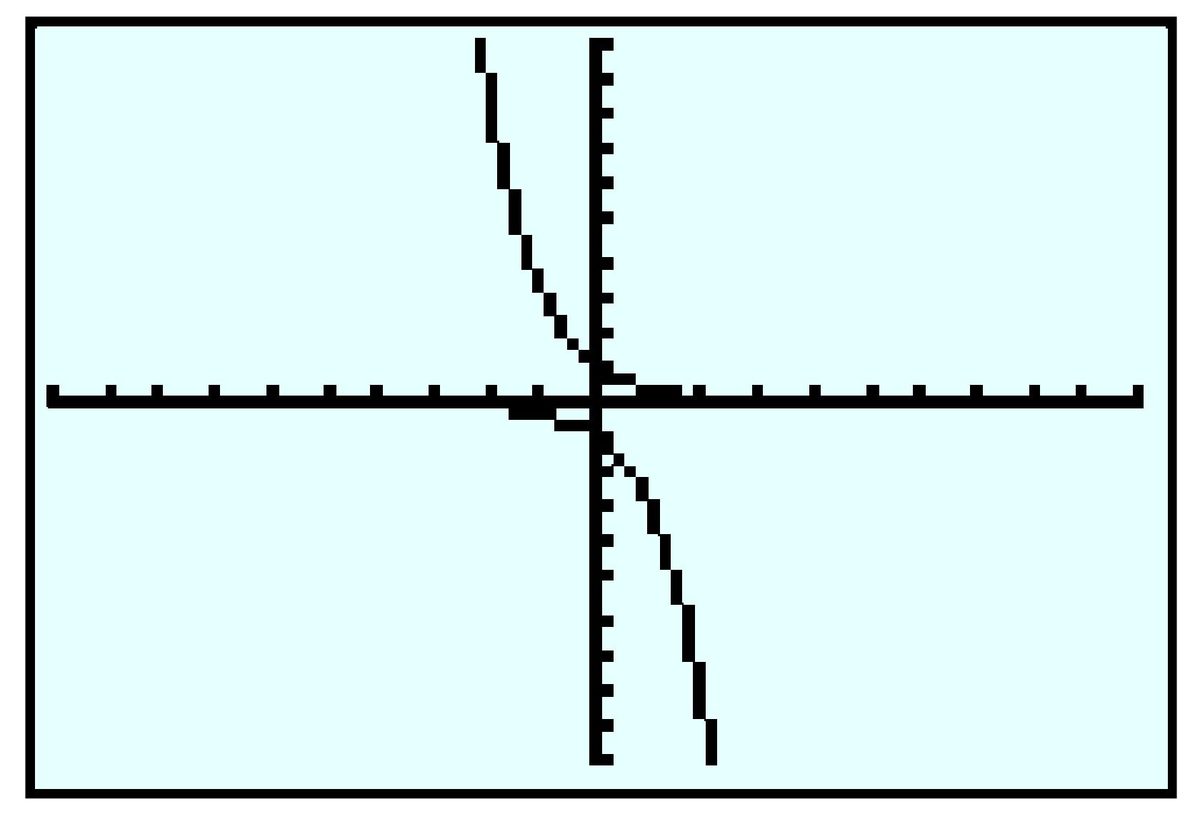
- The graph of is reflected about the -axis; the graph of is reflected about the -axis.
,
In Problems 19–22, for the given function, evaluate each pair of expressions. Are they equivalent?
- and
- and
- is not equivalent to .
- is not equivalent to .
- and
- and
- and
- and
- is not equivalent to .
- is equivalent to .
- and
- and
The graph of is shown in the figure.
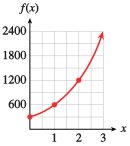
- Read the value of from the graph.
- Make a short table of values for the function by reading values from the graph. Does your table confirm that the function is exponential?
- Use your table to calculate the growth factor, .
- Using your answers to parts (a) and (c), write a formula for .
The graph of is shown in the figure.
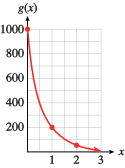
- Read the value of from the graph.
- Make a short table of values for the function by reading values from the graph. Does your table confirm that the function is exponential?
- Use your table to calculate the decay factor, .
- Using your answers to parts (a) and (c), write a formula for .
For several days after the Northridge earthquake on January 17, 1994, the area received a number of significant aftershocks. The red graph shows that the number of aftershocks decreased exponentially over time. The graph of the function , shown in black, approximates the data. (Source: Los Angeles Times, June 27, 1995)
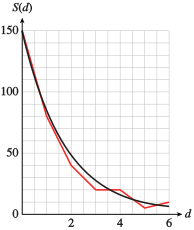
- Read the value of from the graph.
- Find an approximation for the decay factor, , by comparing two points on the graph. (Some of the points on the graph of are approximately , , , and .)
- Using your answers to (a) and (b), write a formula for .
The frequency of a musical note depends on its pitch. The graph shows that the frequency increases exponentially. The function gives the frequency as a function of the number of half-tones, , above the starting point on the scale.
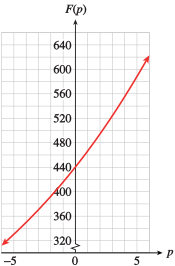
- Read the value of from the graph. (This is the frequency of the note A above middle C.)
- Find an approximation for the growth factor, , by comparing two points on the graph. (Some of the points on the graph of are approximately , , , and .)
- Using your answers to (a) and (b), write a formula for .
- The frequency doubles when you raise a note by one octave, which is equivalent to half-tones. Use this information to find an exact value for .
Solve the equation algebraically.
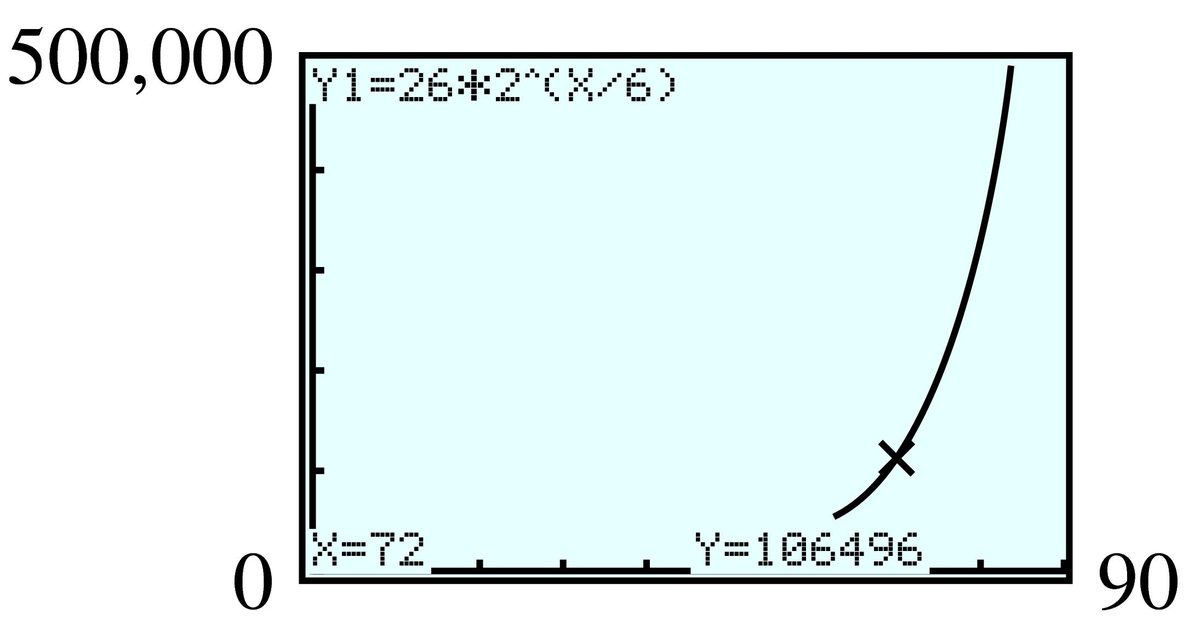
Before the advent of antibiotics, an outbreak of cholera might spread through a city so that the number of cases doubled every days.
- Twenty-six cases were discovered on July 5. Write a function for the number of cases of cholera days later.
- Use your calculator to graph your function on the interval .
- When should hospitals expect to be treating cases? Use algebraic methods to find your answer, and verify it on your graph.
- days later
An outbreak of ungulate fever can sweep through the livestock in a region so that the number of animals affected triples every days.
- A rancher discovers cases of ungulate fever among his herd. Write a function for the number of cases of ungulate fever days later.
- Use your calculator to graph your function on the interval .
- If the rancher does not act quickly, how long will it be until head are affected? Use algebraic methods to find your answer, and verify it on your graph.
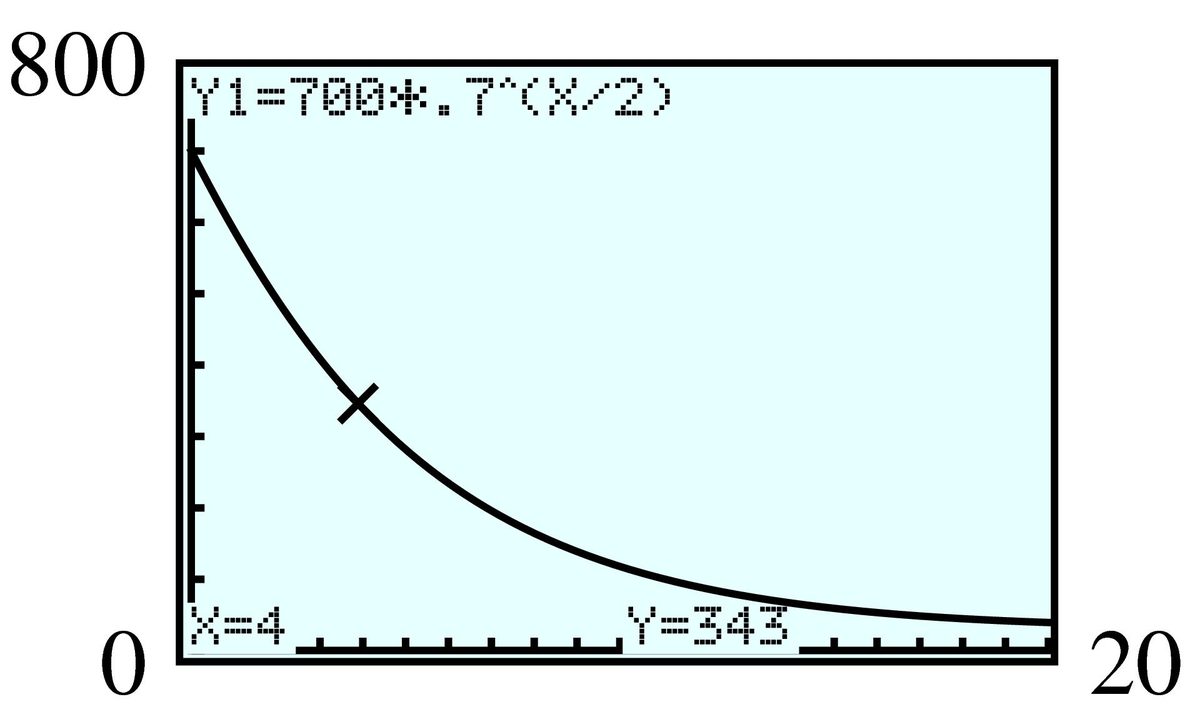
A smart television set loses of its value every years.
- Write a function for the value of a television set years after it was purchased if it cost originally.
- Use your calculator to graph your function on the interval .
- How long will it be before a television set depreciates to ? Use algebraic methods to find your answer, and verify it on your graph.
- yr
A mobile home loses of its value every years.
- A certain mobile home costs . Write a function for its value after years.
- Use your calculator to graph your function on the interval .
- How long will it be before a mobile home depreciates to ? Use algebraic methods to find your answer, and verify it on your graph.
For Problems 41–44, use a graph to find an approximate solution accurate to the nearest hundredth.
For Problems 45 and 46, decide whether each function is an exponential function, a power function, or neither.
- Power
- Exponential
- Power
- Neither
For Problems 47–50, decide whether the table could describe a linear function, a power function, an exponential function, or none of these. Find a formula for each linear, power, or exponential function.
- Exponential
- Power
- Power
- Exponential
For Problems 51 and 52, fill in the tables. Graph each pair of functions in the same window. Then answer the questions below.
- Give the range of and the range of .
- For how many values of does ?
- Estimate the value(s) of for which .
- For what values of is ?
- Which function grows more rapidly for large values of ?
| 1 | ||
- Range of : ; Range of :
- , ,
- and
- g
For Problems 53–60, sketch the graph of each transformation of the given function, then write a formula and check your sketch with a graphing calculator. State the domain and range of each transformation, its intercept(s), and any asymptotes.
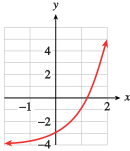
Domain: ; range: , -intercept ; -intercept ; horizontal asymptote- ,
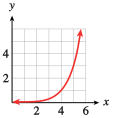
Domain: ; range: , no -intercept; -intercept ; the -axis is the horizontal asymptote. - ,
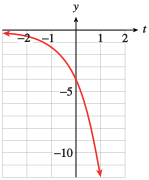
Domain: ; range: , no -intercept; -intercept ; the -axis is the horizontal asymptote.
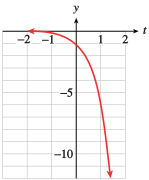
Domain: ; range: , no -intercept; -intercept ; the -axis is the horizontal asymptote.- ,
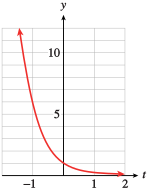
Domain: ; range: , no -intercept; -intercept ; the -axis is the horizontal asymptote. - ,
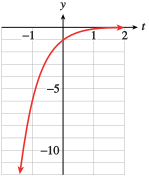
Domain: ; range: , no -intercept; -intercept ; the -axis is the horizontal asymptote.
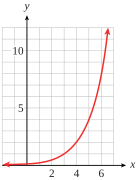
Domain: ; range: , no -intercept; -intercept ; the -axis is the horizontal asymptote.- ,
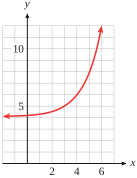
Domain: ; range: , no -intercept; -intercept ; horizontal asymptote
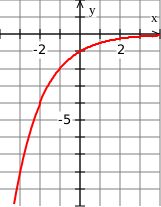
Domain: ; range: , no -intercept; -intercept ; the -axis is the horizontal asymptote.- ,
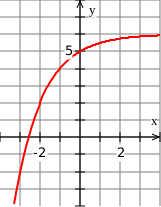
Domain: ; range: , -intercept approximately ; -intercept ; horizontal asymptote is
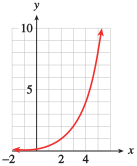
For Problems 61–64,
- Describe the graph as a transformation of .
- Give an equation for the function graphed.
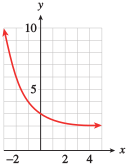
- The graph of has been reflected about the -axis and shifted up units.
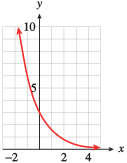
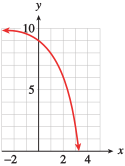
- The graph of has been reflected about the -axis and shifted up units.
For Problems 65 and 66, match the graph of each function to its formula. In each formula, and .
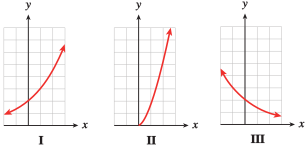
- I
- III
- II
The function describes a volunteer's heart rate during a treadmill test.
The heart rate is given in beats per minute and is in minutes. (See Some Basic Functions to review functions defined piecewise.) (Source: Davis, Kimmet, and Autry, 1986)
- Evaluate the function to complete the table.
- Sketch the graph of the function.
- The treadmill test began with walking at kilometers per hour, then jogging, starting at kilometers per hour and increasing to kilometers per hour, and finished with a cool-down walking period. Identify each of these activities on the graph and describe the volunteer's heart rate during each phase.
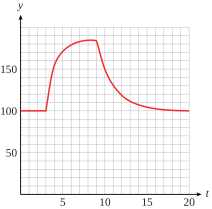
- From to minutes, the volunteer is walking with heart rate beats per minute. The volunteer jogged at a steady pace from to minutes, and the heart rate increased to about beats per minutes. From to minutes, the jogging pace increased, and the heart rate rose to about beats per minute. The cooldown started at minutes, and the heart rate decreased rapidly and leveled off to about beats per minute.
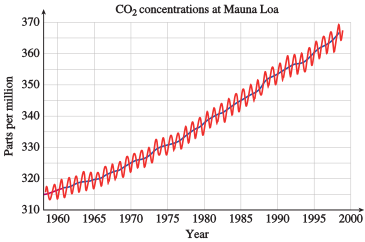
Carbon dioxide () is called a greenhouse gas because it traps part of the Earth's outgoing energy. Animals release into the atmosphere, and plants remove through photosynthesis. In modern times, deforestation and the burning of fossil fuels both contribute to levels. The figure shows atmospheric concentrations of , in parts per million, measured at the Mauna Loa Observatory in Hawaii.
- The red curve shows annual oscillations in levels. Can you explain why levels vary throughout the year? Hint: Why would photosynthesis vary throughout the year?
- The blue curve shows the average annual readings. By approximately how much does the level vary from its average value during the year?
- In 1960, the average level was parts per million, and the average level has been rising by per year. If the level continues to rise at this rate, what readings can we expect in the year 2100?
Modeling, Functions, and Graphs by Katherine Yoshiwara (yoshiwarabooks.org), GNU Free Documentation License 1.2 or later. Adapted for the XYZ HTML edition with the authors' permission (recorded 2026-07-04). License: GFDL-1.2-or-later.