
11.4 Graphing an Equation
We can graph equations written in the form (expression in x). The graphing keys are located on the top row of the keypad. There are two steps to graphing an equation:
- Entering the equation
- Setting the graphing window
Standard Window
The standard window displays values from to on both axes.
Tracing
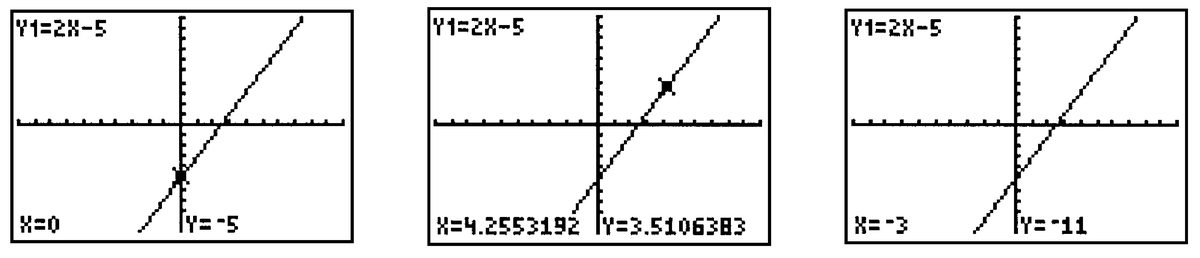
The calculator can display the coordinates of selected points on the graph. Press the TRACE key to see a "bug" blinking on the graph. The coordinates of the bug are displayed at the bottom of the screen. Use the left and right arrow keys to move the bug along the graph, as shown in Figure. Note that the Trace feature does not show every point on the graph!
Multiple Graphs
You can enter more than one graph at a time. Press ↓ to enter a second equation at , at , and so on. When Tracing, press the and keys to move from one graph to another.
To turn off a graph without deleting its equation, press and move the cursor over the sign in the equation. Press ENTER to deactivate that equation. (When you move the cursor away, the sign is no longer highlighted.) To reactivate the equation, move the cursor back over the sign and press ENTER again.
Setting the Window
Of course, the standard window is not suitable for every graph.
Intersect Feature
We can use the calculator to find the intersection point of two graphs:
-
Enter the equations for the two graphs in the
Y=menu. - Choose window settings so that the intersection point is visible in the window.
-
Press
2ndTRACEto activate the intersect feacture. - Use the left and right arrow keys to position the bug near the intersection point.
-
Respond to each of the calculator’s questions, First curve?, Second curve?, and Guess? by pressing
ENTER. The coordinates of the intersection point are then displayed at the bottom of the screen.
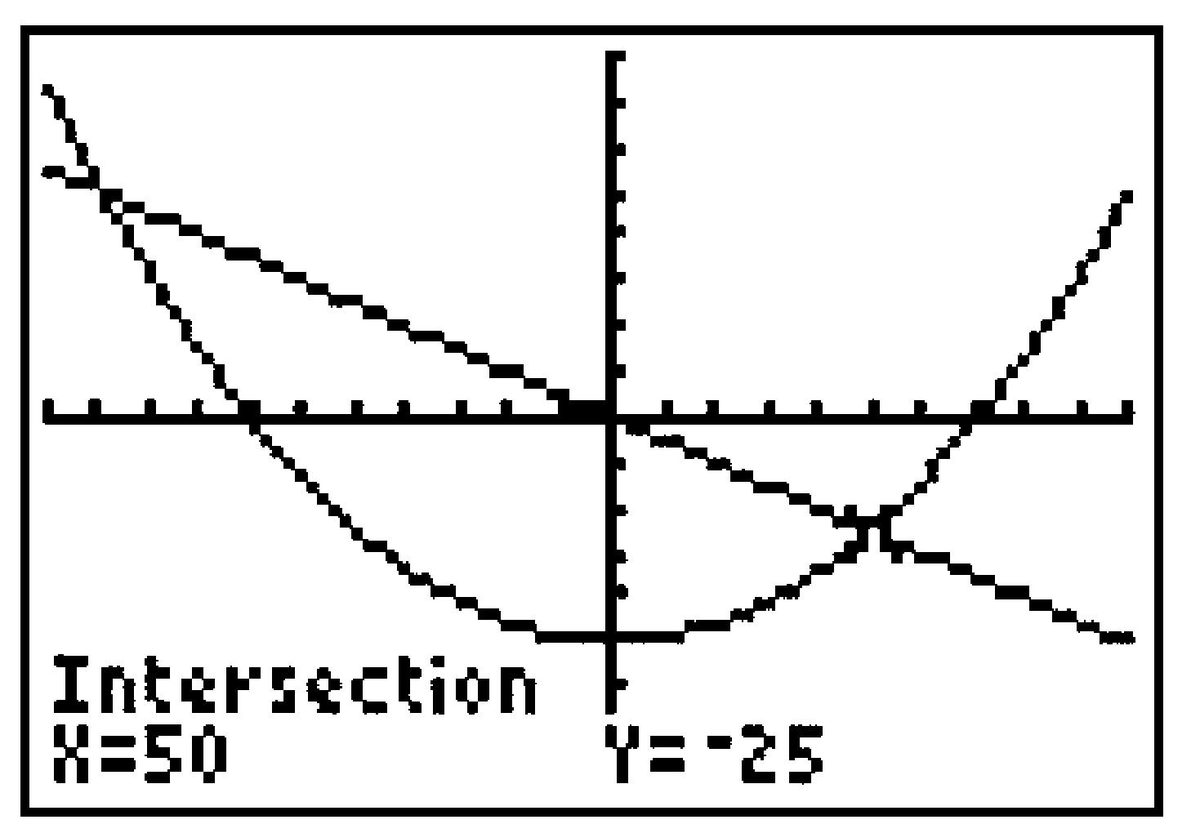
Figure shows one of the intersection points of and .
Other Windows
-
The ZDecimal (Zoom Decimal) window, accessed by pressing
ZOOM, shows -values from to only, but the Trace feature shows "nice" -values in increments of . -
The ZInteger (Zoom Integer) window shows nice -values in increments of unit. Access the ZInteger window as follows: Press
ZOOM, move the bug with the arrow keys to the center of your new window, and pressENTER. -
The ZSquare window, accessed by pressing
ZOOM, makes the tick marks on both axes have the same size. In this window, squares look like squares, circles look like circles, and all angles appear true. - "Friendly" Windows: If the difference between Xmin and Xmax is a multiple of , the Trace feature gives nice values for . A useful example of a friendly window is , .
Troubleshooting
-
If the graph is not visible, you may need to adjust your window. Or, the equation may not be activated. Press
Y=and check to see if the sign is highlighted. -
If you get a range error, ERR: WINDOW RANGE, quit the message and press
WINDOW. Alter the window settings so that Xmin is smaller than Xmax and so that Ymin is smaller than Ymax. - If you press and get an unfamiliar window, or if the axes are not visible in the ZStandard window, you may need to return the Mode or Format menus to their default settings. See Troubleshooting in Getting Started.
-
If you get a dimension error, ERR: INVALID DIM, you may have a StatPlot turned on. Press
2ndY=ENTERto turn off the StatPlots. -
If the bug does not move along the curve,
TRACEmay not be activated. PressTRACEand then the left or right arrow key. - If you get the error, ERR: INVALID, you have probably entered a value of that is outside the window. Adjust the window settings accordingly.
-
If the -axis or -axis is too thick, the tick marks are too close together. Press
WINDOWand make Xscl or Yscl larger. Set or to remove the tick marks. - If you get ERR: NO SIGN CHNG when using the intersect feature, the calculator did not find any intersection point within the current window. Alter the window settings so that the two curves meet within the window. If the two curves are tangent, the calculator may simply fail to find the point of intersection.
Modeling, Functions, and Graphs by Katherine Yoshiwara (yoshiwarabooks.org), GNU Free Documentation License 1.2 or later. Adapted for the XYZ HTML edition with the authors' permission (recorded 2026-07-04). License: GFDL-1.2-or-later.