
6.6 Curve Fitting
Introduction
In Linear Regression, we used linear regression to fit a line to a collection of data points. If the data points do not cluster around a line, it does not make sense to describe them by a linear function. Compare the scatterplots shown below.
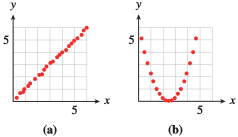
The points in figure (a) are roughly linear in appearance, but the points in figure (b) are not. However, we can visualize a parabola that would approximate the data. In this section, we will see how to fit a quadratic function to a collection of data points.
We will need to solve a special type of linear system, that is, a linear system of three equations in three variables. We can solve these systems using the elimination method. See Appendix to review the elimination method.
Follow the steps to solve the system
- Eliminate from Equations (1) and (2) to obtain a new Equation (4).
_____ - Eliminate from Equations (2) and (3) to obtain a new Equation (5).
_____ - Solve the system of Equations (4) and (5).
_____, _____ - Substitute the values of and into one of the original equations to find .
_____
- ,
Follow the steps to solve the system
- Eliminate from Equations (1) and (2) to obtain a new Equation (4).
- Eliminate from Equations (2) and (3) to obtain a new Equation (5).
- Solve the system of Equations (4) and (5).
- Substitute the values of and into one of the original equations to find .
- ,
Finding a Quadratic Function through Three Points
Every linear function can be written in the form
To find a specific line, we must find values for the two parameters (constants) and . We need two data points in order to find those two parameters. A quadratic function, however, has three parameters, , , and :
To find these parameters, we need three data points. We then use the method of elimination to solve a system of three linear equations.
When we solve a system to fit a parabola through three points, which variable should we eliminate first?
_____
When we solve a system to fit a parabola through three points, which variable should we eliminate first?
- Find the equation of a parabola
that passes through the points , , and .
_____ - Plot the data points and sketch the parabola.
- A graph is below.
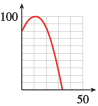
- Find the equation of a parabola that passes through the points , , and .
- Plot the data points and sketch the parabola.
The simplest way to fit a parabola to a set of data points is to pick three of the points and find the equation of the parabola that passes through those three points.
Sara plans to start a side business selling eggs. She finds that the total number of eggs produced each day depends on the number of hens confined in the henhouse, as shown in the table. Use the first three data points to find a quadratic model .
_____
Plot the data and sketch the curve on the same axes.
| Number of hens, | ||||||
|---|---|---|---|---|---|---|
| Number of eggs, |
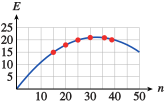
A graph is below.
Sara plans to start a side business selling eggs. She finds that the total number of eggs produced each day depends on the number of hens confined in the henhouse, as shown in the table. Use the first three data points to find a quadratic model . Plot the data and sketch the curve on the same axes.
| Number of hens, | ||||||
|---|---|---|---|---|---|---|
| Number of eggs, |
Explain how to fit a parabola through three points.
_____
Explain how to fit a parabola through three points.
Finding an Equation in Vertex Form
It is easier to find a quadratic model if one of the points we know happens to be the vertex of the parabola. In that case, we need only one other point, and we can use the vertex form to find its equation.
If you know the vertex of a parabola, how many more points do you need to find its equation?
_____
One
If you know the vertex of a parabola, how many more points do you need to find its equation?
- One
- Two
- Three
- Four
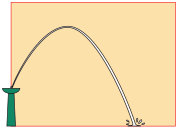
Francine is designing a synchronized fountain display for a hotel in Las Vegas. For each fountain, water emerges in a parabolic arc from a nozzle feet above the ground. Francine would like the vertex of the arc to be feet high and feet horizontally from the nozzle.
- Choose a coordinate system for the diagram below and write a function for the path of the water.
With the origin on the ground directly below the nozzle,
_____ Use to represent the horizontal distance from the origin. - How far from the base of the nozzle will the stream of water hit the ground?
Answer: _____ feet
- With the origin on the ground directly below the nozzle, .
- Approximately feet
Francine is designing a synchronized fountain display for a hotel in Las Vegas. For each fountain, water emerges in a parabolic arc from a nozzle feet above the ground. Francine would like the vertex of the arc to be feet high and feet horizontally from the nozzle.
- Choose a coordinate system for the diagram below and write a function for the path of the water.
- How far from the base of the nozzle will the stream of water hit the ground?
- With the origin on the ground directly below the nozzle, .
- Approximately feet
To test the effects of radiation, a researcher irradiated male mice with various dosages and bred them with unexposed female mice. The table below shows the fraction of fertilized eggs that survived, as a function of the radiation dosage. (Source: Strickberger, Monroe W., 1976)
| Radiation (rems) | |||||||
|---|---|---|---|---|---|---|---|
| Relative survival of eggs |
- Enter the data into your calculator and create a scatterplot. Does the graph appear to be linear? Does it appear to be quadratic? _____
- Fit a quadratic regression equation to the data and graph the equation on the scatterplot.
_____
- The graph appears to be quadratic.
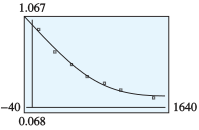
To test the effects of radiation, a researcher irradiated male mice with various dosages and bred them with unexposed female mice. The table below shows the fraction of fertilized eggs that survived, as a function of the radiation dosage. (Source: Strickberger, Monroe W., 1976)
| Radiation (rems) | |||||||
|---|---|---|---|---|---|---|---|
| Relative survival of eggs |
- Enter the data into your calculator and create a scatterplot. Does the graph appear to be linear? Does it appear to be quadratic?
- Fit a quadratic regression equation to the data and graph the equation on the scatterplot.
- The graph appears to be quadratic.
How many data points must a quadratic regression graph pass through?
_____
None
How many data points must a quadratic regression graph pass through?
- One
- Two
- Three
- None
Using the wrong type of function to fit the data is a common error in making predictions. We know that the minute hand of a clock repeats its position every minutes. The graph of the height of its tip oscillates up and down, repeating the same pattern over and over. We cannot describe such a graph using either a linear or a quadratic function.
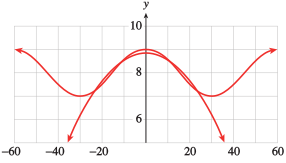
The graph of the height is shown at left, along with the graph of our quadratic regression equation. You can see that the regression equation fits the actual curve only on a small interval.
Your calculator can always compute a regression equation, but that equation is not necessarily appropriate for your data. Choosing a reasonable type of regression equation for a particular data set requires knowledge of different kinds of models and the physical or natural laws that govern the situation at hand.
Which statement is true?
_____
We can use elimination to fit a parabola through three points.
Which statement is true?
- A parabola is a good model for any non-linear curve.
- We will get the same equation by fitting a parabola through any three points of a data set.
- We can use elimination to fit a parabola through three points.
- When we use quadratic regression, the lowest (or highest) point of a data set will be the vertex of the parabola.
A speeding motorist slams on the brakes when she sees an accident directly ahead of her. The distance she has traveled seconds after braking is shown in the table.
| Time (seconds) | ||||||
|---|---|---|---|---|---|---|
| Distance (feet) |
- Enter the data into your calculator and create a scatterplot. Fit a quadratic regression equation to the data and graph the equation on the scatterplot.
Regression equation: _____ Use for the time in seconds. - Use your regression equation to find the vertex of the parabola: _____
What do the coordinates represent in terms of the problem?
- A graph is below.
- : The car came to a stop in seconds, after sliding feet.
A graph for part (a):
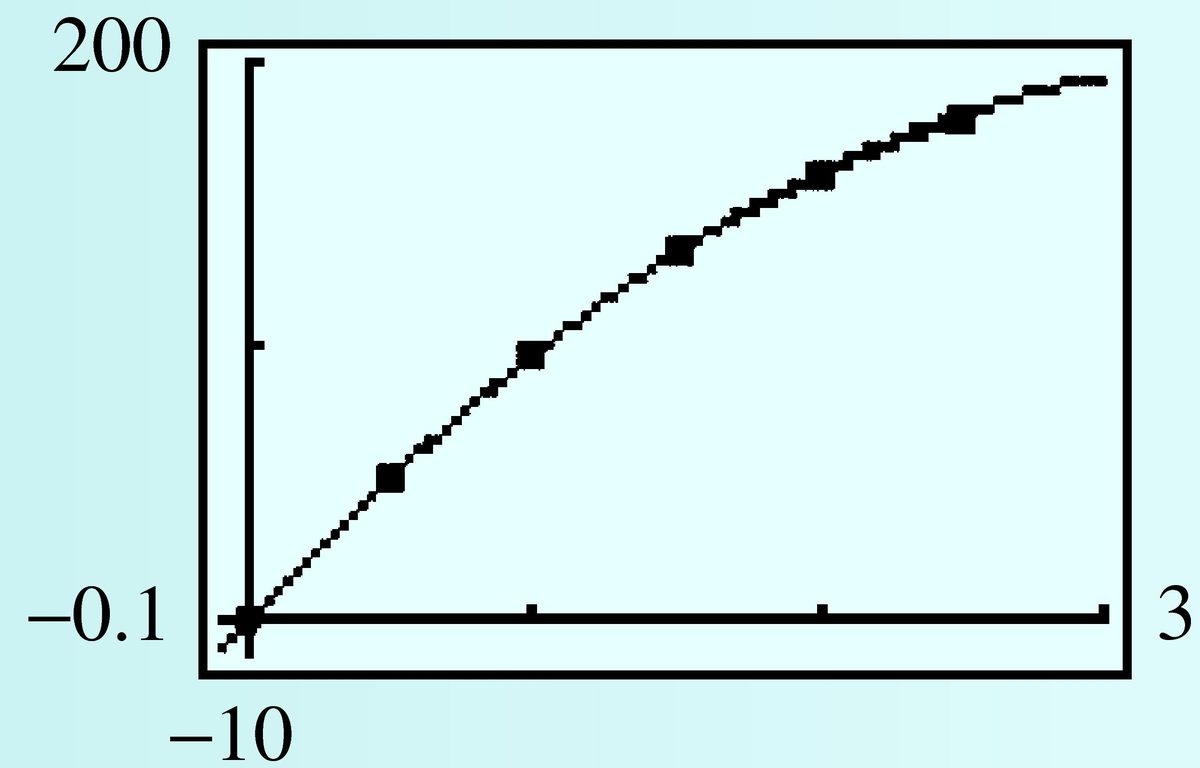
A speeding motorist slams on the brakes when she sees an accident directly ahead of her. The distance she has traveled seconds after braking is shown in the table.
| Time (seconds) | ||||||
|---|---|---|---|---|---|---|
| Distance (feet) |
- Enter the data into your calculator and create a scatterplot. Fit a quadratic regression equation to the data and graph the equation on the scatterplot.
- Use your regression equation to find the vertex of the parabola. What do the coordinates represent in terms of the problem?
- : The car came to a stop in seconds, after sliding feet.
Why is it a bad idea to clculate a regression equation without first plotting the data?
_____
Why is it a bad idea to clculate a regression equation without first plotting the data?
Section Summary
Vocabulary
Look up the definitions of new terms in the Glossary.
- Elimination method
- Quadratic regression
CONCEPTS
- We need three points to determine a parabola.
- We can use the method of elimination to find the equation of a parabola through three points.
- If we know the vertex of a parabola, we need only one other point to find its equation.
- We can use quadratic regression to fit a parabola to a collection of data points.
STUDY QUESTIONS
- How many points are necessary to determine a parabola?
- Why do we need a second point to find the equation of a parabola if we know its vertex?
- How can you decide whether linear regression, quadratic regression, or neither one is appropriate for a collection of data?
SKILLS
Practice each skill in the Homework problems listed.
- Fit a quadratic equation through three points: #5–12
- Find a quadratic model in vertex form: #13–30
- Use quadratic regression to fit a parabola to data: #31–34
Homework 6.6
For Problems 1–4, solve the system by elimination. Begin by eliminating .
For Problems 5–12, find a quadratic equation that fits the data points.
Find values for , , and so that the graph of the parabola includes the points , , and .
. The equation for the parabola is
Find values for , , and so that the graph of the parabola includes the points , , and .
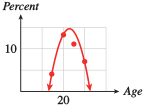
A survey to determine what percent of different age groups regularly use marijuana collected the following data.
| Age | ||||
|---|---|---|---|---|
| Percent |
- Use the percentages for ages , , and to fit a quadratic function to the data, , where represents age.
- What does your function predict for the percentage of -year-olds who use marijuana?
- Sketch the graph of your quadratic function and the given data on the same axes.
- . It predicts that of the -year old population use marijuana on a regular basis.
The following data show the number of people of certain ages who were the victims of homicide in a large city last year.
| Age | ||||
|---|---|---|---|---|
| Number of victims |
- Use the first three data points to fit a quadratic function to the data, , where represents age.
- What does your function predict for the number of -year-olds who were the victims of homicide?
- Sketch the graph of your quadratic function and the given data on the same axes.
The data below show Americans' annual per capita consumption of chicken for several years since .
| Year | |||||
|---|---|---|---|---|---|
| Pounds of chicken |
- Use the values for through to fit a quadratic function to the data, , where is measured in years since .
- What does your function predict for per capita chicken consumption in ?
- Sketch the graph of your function and the given data.
- lb
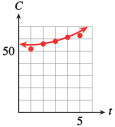
The data show sales of in-line skates at a sporting goods store at the beach.
| Year | |||||
|---|---|---|---|---|---|
| Skate sold |
- Use the values for through to fit a quadratic function to the data, , where is measured in years since .
- What does your function predict for the number of pairs of skates sold in ?
- Sketch the graph of your function and the given data.
Find a quadratic function for the number of diagonals that can be drawn in a polygon of sides. Some data are provided.
| Sides | ||||
|---|---|---|---|---|
| Diagonals |
You are driving at miles per hour when you step on the brakes. Find a quadratic function for the distance in feet that your car travels in seconds after braking. Some data are provided.
| Seconds | ||||
|---|---|---|---|---|
| Feet |
- Write an equation for a parabola whose vertex is the point . (Many answers are possible.)
- Find the value of if the -intercept of the parabola in part (a) is .
- Write an equation for a parabola whose vertex is the point . (Many answers are possible.)
- Find the value of if the -intercept of the parabola in part (a) is .
- Write an equation for a parabola with vertex at and one of its -intercepts at .
- Write an equation for a parabola with vertex at and no -intercepts.
- for any
Write an equation for a parabola with vertex at and -intercept at . How many -intercepts does the parabola have?
Find the equation for a parabola that has a vertex of and passes through the point .
Find the equation for a parabola that has a vertex of and passes through the point .
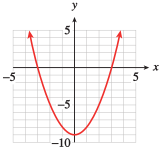
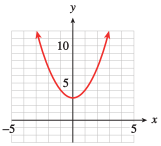
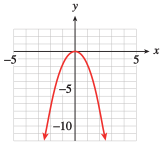
For Problems 19–26, find an equation for each parabola. Use the vertex form or the factored form of the equation, whichever is more appropriate.
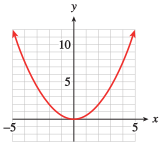
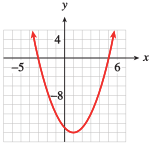
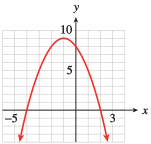
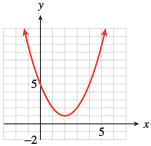
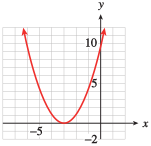
In skeet shooting, the clay pigeon is launched from a height of feet and reaches a maximum height of feet at a distance of feet from the launch site.
- Write a function for the height of the clay pigeon in terms of the horizontal distance it has traveled.
- If the shooter misses the clay pigeon, how far from the launch site will it hit the ground?
- ft
The batter in a softball game hits the ball when it is feet above the ground. The ball reaches the greatest height on its trajectory, feet, directly above the head of the left-fielder, who is feet from home plate.
- Write a function for the height of the softball in terms of its horizontal distance from home plate.
- Will the ball clear the left field wall, which is feet tall and feet from home plate?
The cables on a suspension bridge hang in the shape of parabolas. For Problems 29–30, imagine a coordinate system superimposed on a diagram of the bridge, as shown in the figure.
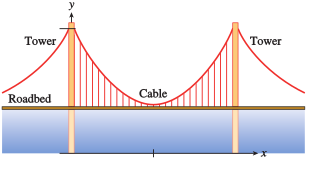
The Akashi Kaikyo bridge in Japan is the longest suspension bridge in the world, with a main span of meters. Its main towers are meters tall. The roadbed of the bridge is meters thick and clears the water below by meters.
- Find the coordinates of the vertex and one other point on the cable.
- Use the points from part (a) to find an equation for the shape of the cable in vertex form.
- Vertex: ; -intercept:
A suspension bridge joining Sicily to the tip of Italy over the Straits of Messina has been planned planned and canceled multiple times. The main span of the bridge should be meters, and its main towers meters tall. The roadbed should be meters thick, clearing the water below by meters.
- Find the coordinates of the vertex and one other point on the cable.
- Use the points from part (a) to find an equation for the shape of the cable in vertex form.
The Square Kilometre Array (SKA) is an international radio telescope project. Project members plan to build a telescope 30 times larger than the largest one currently available. The Australia Telescope National Facility held a workshop in 2005 to design an appropriate antenna. The antenna should be a parabolic dish with diameter from to meters, and the ratio of the focal length to the diameter should be . The figure shows a cross section of the dish. (Source: www.atnf.csiro.au/projects/ska/)
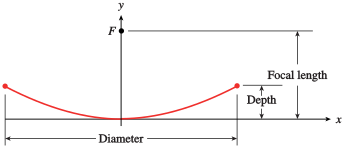
- You want to design a -meter-diameter parabolic antenna for the project. What will the focal length of your antenna be?
- The equation of the dish has the form , where is the focal length. What is the equation of the parabola for your antenna?
- What is the depth of your parabolic antenna?
- m
- m
Some comets move about the sun in parabolic orbits. In 1973, the comet Kohoutek passed within 0.14 AU (astronomical units), or 21 million kilometers, of the Sun. Imagine a coordinate system superimposed on a diagram of the comet’s orbit, with the Sun at the origin, as shown in the figure. The units on each axis are measured in AU.
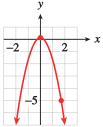
- The comet's closest approach to the Sun (called perihelion) occurred at the vertex of the parabola. What were the comet’s coordinates at perihelion?
- When the comet was first discovered, its coordinates were . Find an equation for comet Kohoutek's orbit in vertex form.
Use your calculator's statistics features for Problems 33–38.
The table shows the height of a projectile at different times after it was fired.
| Time (seconds) | |||||||
|---|---|---|---|---|---|---|---|
| Height (meters) |
- Find the equation of the least-squares regression line for height in terms of time.
- Use the linear regression equation to predict the height of the projectile seconds after it was fired.
- Make a scatterplot of the data and draw the regression line on the same axes.
- Find the quadratic regression equation for height in terms of time.
- Use the quadratic regression equation to predict the height of the projectile seconds after it was fired.
- Draw the quadratic regression curve on the graph from part (c).
- Which model is more appropriate for the height of the projectile, linear or quadratic? Why?
- m
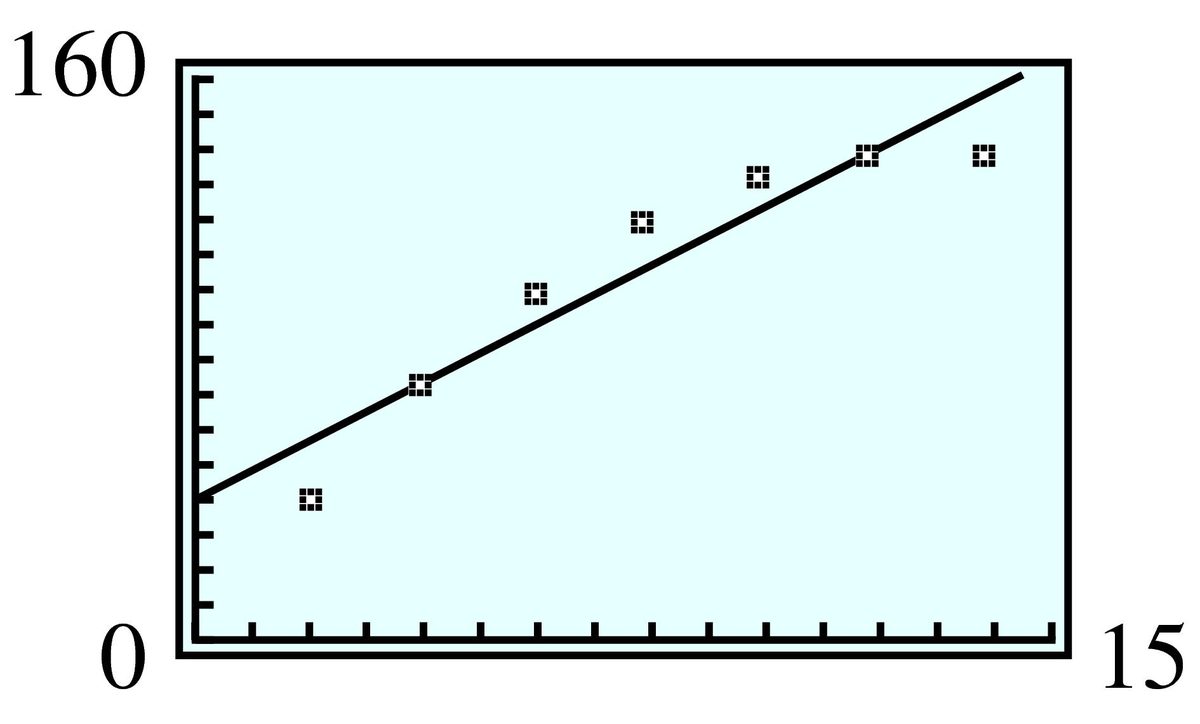
- m
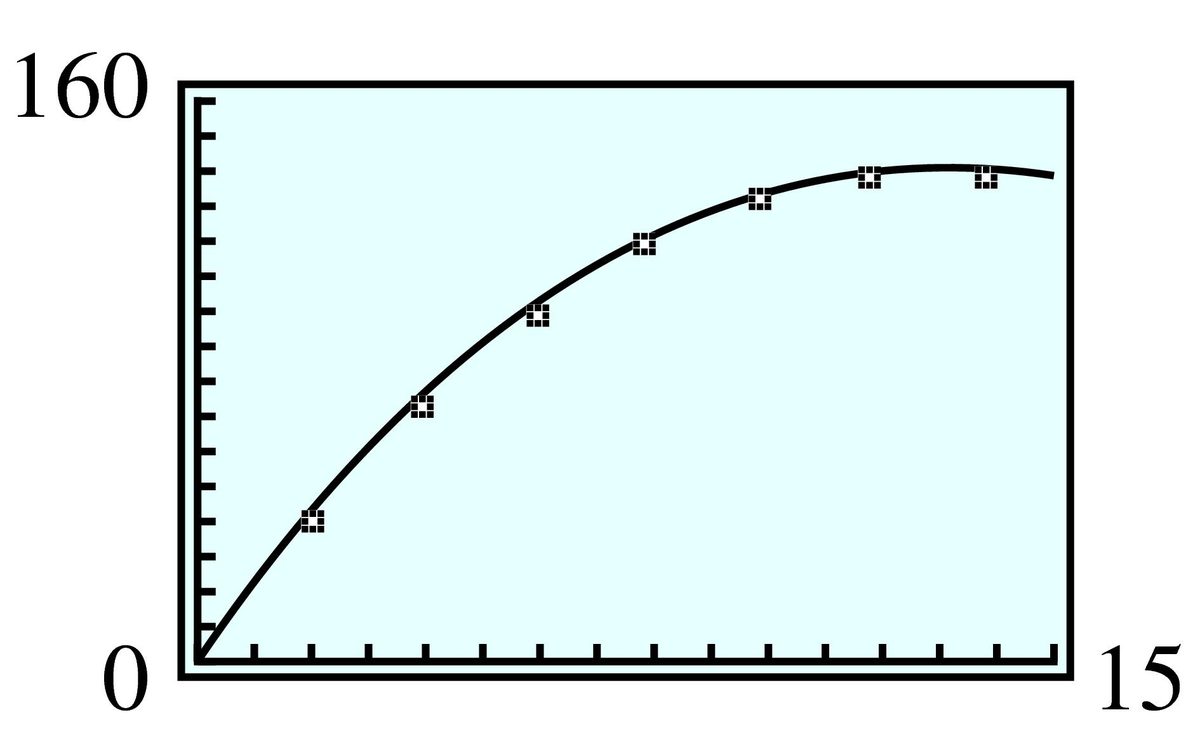
- Quadratic: Gravity will slow the projectile, giving the graph a concave down shape.
The table shows the height of a star-flare at different times after it exploded from the surface of a star.
| Time (seconds) | ||||||
|---|---|---|---|---|---|---|
| Height (kilometers) |
- Find the equation of the least-squares regression line for height of the flare in terms of time.
- Use the linear regression equation to predict the height of the flare seconds after it exploded.
- Make a scatterplot of the data and draw the regression line on the same axes.
- Find the quadratic regression equation for height in terms of time.
- Use the quadratic regression equation to predict the height of the flare seconds after it exploded.
- Draw the quadratic regression curve on the graph from part (c).
- Which model is more appropriate for the height of the star-flare, linear or quadratic? Why?
In the 1990s, an outbreak of mad cow disease (Creutzfeldt-Jakob disease) alarmed health officials in England. The table shows the number of deaths each year from the disease.
| Year | '94 | '95 | '96 | '97 | '98 | '99 | 2000 | '01 | '02 | '03 | '04 |
|---|---|---|---|---|---|---|---|---|---|---|---|
| Deaths |
(Source: www.cjd.ed.ac.uk/vcjdqsep05)
- The Health Protection Agency determined that a quadratic model was the best-fitting model for the data. Find a quadratic regression equation for the data.
- Use your model to estimate when the peak of the epidemic occurred and how many deaths from mad cow disease were expected in 2005.
- The predicted peak was in 2000, near the end of March. The model predicts deaths for 2005.
The table shows the amount of nitrogen fertilizer applied to a crop of soybeans per hectare of land in a trial in Thailand and the resulting yield.
| Nitrogen (kg) | |||||
|---|---|---|---|---|---|
| Yield (tons) |
(Source: www.arc-avrdc.org)
- Fit a quadratic regression equation to the data.
- Use your model to predict the maximum yield and the amount of nitrogen needed.
The number of daylight hours increases each day from the beginning of winter until the beginning of summer, and then begins to decrease. The table below gives the number of daylight hours in Delbert's hometown last year in terms of the number of days since January 1.
| Days since January 1 | |||||||
|---|---|---|---|---|---|---|---|
| Hours of daylight |
- Find the equation of the least-squares regression line for the number of daylight hours in terms of the number of days since January 1.
- Use the linear regression equation to predict the number of daylight hours days after January 1.
- Make a scatterplot of the data and draw the regression line on the same axes.
- Find the quadratic regression equation for the number of daylight hours in terms of the number of days since January 1.
- Use the quadratic regression equation to predict the number of daylight hours days after January 1.
- Draw the quadratic regression curve on the graph from part (c).
- Predict the number of daylight hours days since January 1 without using any regression equation. What does this tell you about the linear and quadratic models you found?
- hr
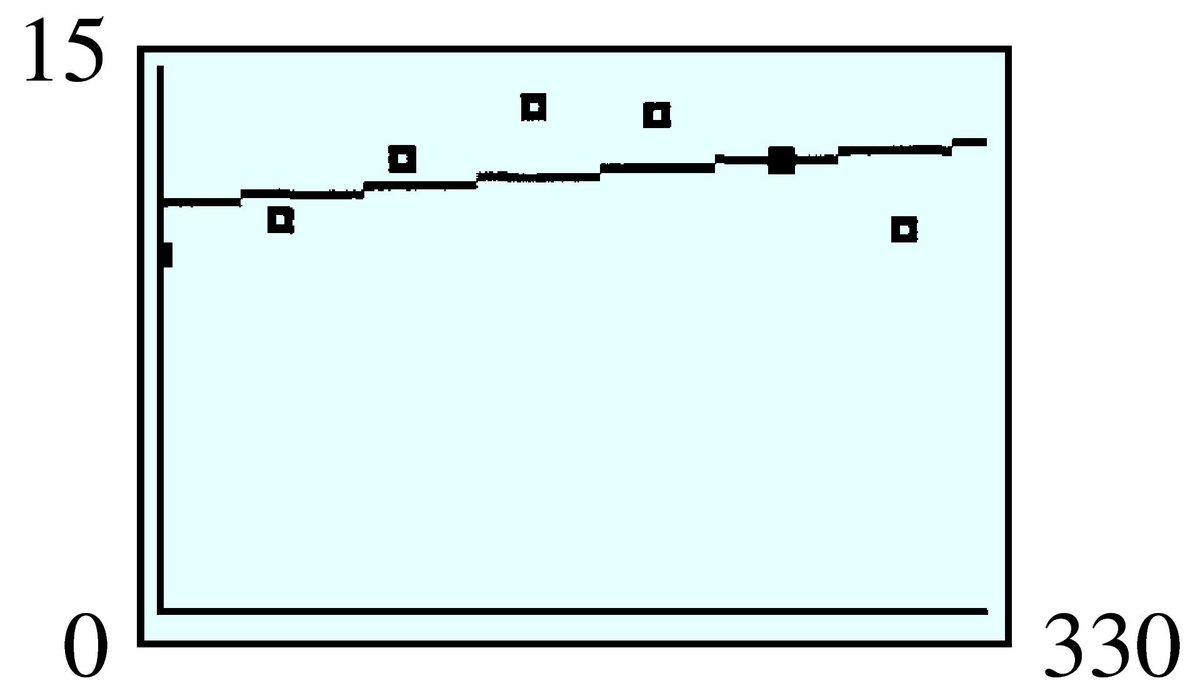
- hr
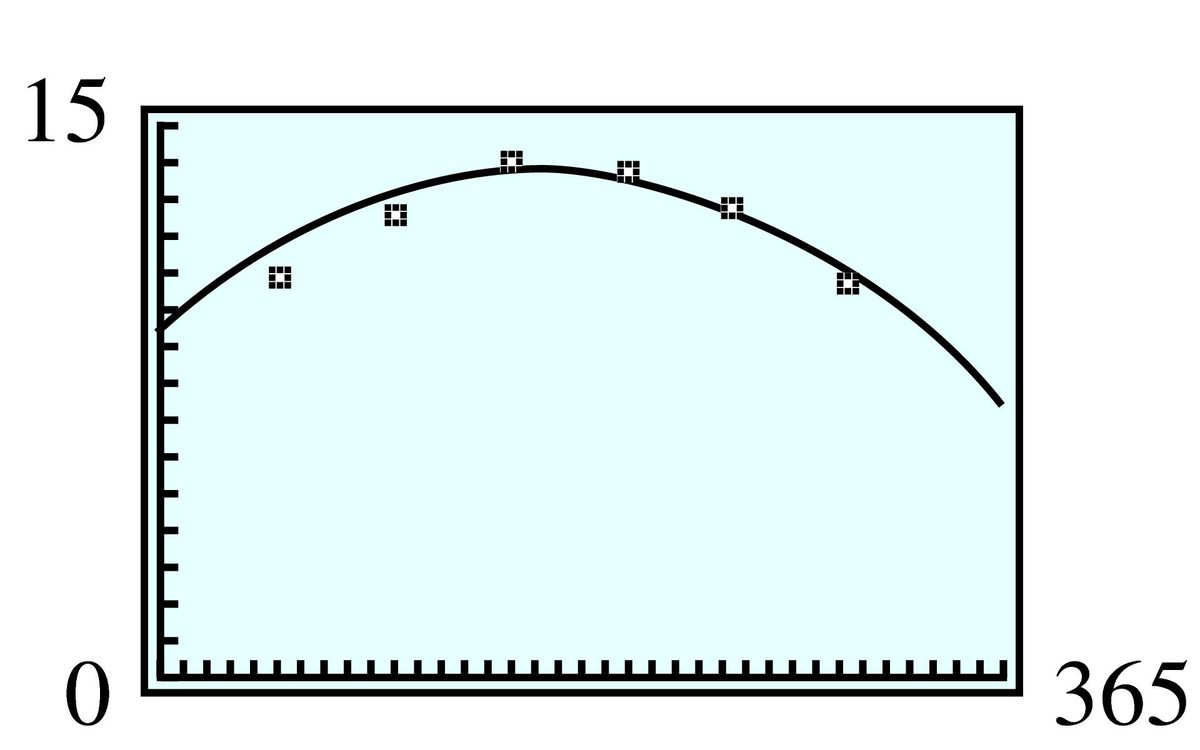
- hr (the same as the previous year); Neither model is appropriate.
To observers on Earth, the Moon looks like a disk that is completely illuminated at full moon and completely dark at new moon. The table below shows what fraction of the Moon is illuminated at -day interval after the last full moon.
| Days since full moon | ||||||
|---|---|---|---|---|---|---|
| Fraction illuminated |
(Source: www.arc-avrdc.org)
- Find the equation of the least-squares regression line for the fraction illuminated in terms of days.
- Use the linear regression equation to predict the fraction illuminated days after the full moon.
- Make a scatterplot of the data and draw the regression line on the same axes.
- Find the quadratic regression equation for the fraction illuminated in terms of days.
- Use the quadratic regression equation to predict the fraction illuminated days after the full moon.
- Draw the quadratic regression curve on the graph from part (c).
- Predict the fraction of the disk that is illuminated days after the full moon without using any regression equation. What does this tell you about the linear and quadratic models you found?
Modeling, Functions, and Graphs by Katherine Yoshiwara (yoshiwarabooks.org), GNU Free Documentation License 1.2 or later. Adapted for the XYZ HTML edition with the authors' permission (recorded 2026-07-04). License: GFDL-1.2-or-later.