
6.3 Graphing Parabolas
Introduction
The graph of a quadratic function is called a parabola. Some parabolas are shown below.
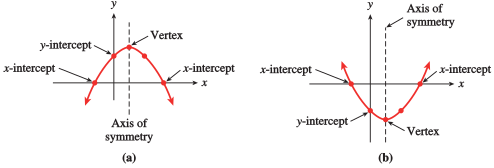
All these parabolas share certain features.
- The graph has either a highest point (if the parabola opens downward, as in figure (a) or a lowest point (if the parabola opens upward, as in figure (b). This high or low point is called the vertex of the graph.
- The parabola is symmetric about a vertical line, called the axis of symmetry, that runs through the vertex.
- The -intercept is the point where the parabola intersects the -axis. The graph of a quadratic function always has exactly one -intercept.
- However, the graph may cross the -axis at one point, at two points, or not at all. Points where the parabola intersects the -axis are called the -intercepts. If there are two -intercepts, they are equidistant from the axis of symmetry.
- The values of the constants , , and determine the location and orientation of the parabola. We will begin by considering each of these constants separately.
Which point on a parabola always lies on the axis of symmetry?
_____
The vertex
Which point on a parabola always lies on the axis of symmetry?
- The -intercept
- The -intercept
- The vertex
- The origin
The Graph of
In Modeling with Functions, we saw that the graph of is a transformation of the graph of . The scale factor, , stretches or compresses the graph vertically, and if is negative, the graph is reflected about the -axis.
What does the value of tell us about the graph of ?
_____
The width of the parabola
What does the value of tell us about the graph of ?
- The -intercept
- The number of -intercepts
- The -coordinate of the vertex
- The width of the parabola
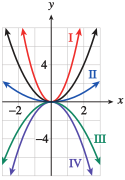
Match each parabola in the figure above with its equation. The basic parabola is shown in black.
- _____
- _____
- _____
- _____
- III
- II
- I
- IV
Match each parabola in the figure above with its equation. The basic parabola is shown in black.
- III
- II
- I
- IV
The Graph of
Next, we consider the effect of the constant term, , on the graph. Adding a constant to the formula for causes a vertical translation of the graph.
Which of these is the equation of a parabola that has no -intercepts?
_____
Which of these is the equation of a parabola that has no -intercepts?
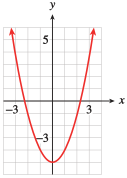
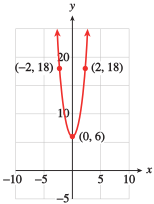
- Find an equation for the parabola shown above.
_____ - Give the - and -intercepts of the graph.
-intercepts: _____ Note: Use a comma to separate different points.
-intercept: _____
- -intercepts: ; -intercept:
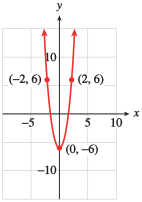
- Find an equation for the parabola shown at right.
- Give the - and -intercepts of the graph.
- -intercepts: ; -intercept:
Describe what the parameters and tell you about the graph of .
_____
Describe what the parameters and tell you about the graph of .
The Graph of
How does the linear term, , affect the graph? Let us begin by considering an example. Graph the function
on your calculator. The graph is shown at right.
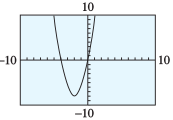
Note that and that , so the parabola opens upward. We can find the -intercepts of the graph by setting equal to zero:
The solutions of this equation are and , so the -intercepts are the points and .
Recall that the parabola is symmetric about a vertical line through its vertex. (We will prove that this is true in the Homework problems.) The two -intercepts are equidistant from this line of symmetry, so the -coordinate of the vertex lies exactly halfway between the -intercepts. We can average their values to find
To find the -coordinate of the vertex, substitute into the equation for the parabola:
Thus, the vertex is the point .
- Find the -intercepts and the vertex of the parabola .
-intercepts: _____ Note: Use a comma to separate different points.
Vertex: _____ - Verify your answers by graphing the function in the window
-intercepts: and ; vertex:
- Find the -intercepts and the vertex of the parabola .
- Verify your answers by graphing the function in the window
-intercepts: and ; vertex:
Finding the Vertex
We can use the same method to find a formula for the vertex of any parabola of the form
We proceed as we did in the previous example.
First, find the -intercepts of the graph by setting equal to zero and solving for .
Thus,
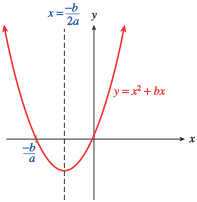
The -intercepts are the points and .
Next, we find the -coordinate of the vertex by taking the average of the two -intercepts found above:
This gives us a formula for the -coordinate of the vertex.
Also, the axis of symmetry is the vertical line as shown in the figure above. Finally, we find the -coordinate of the vertex by substituting its -coordinate into the equation for the parabola.
Explain why the -coordinate of the vertex is the average of the -intercepts of the graph.
_____
Explain why the -coordinate of the vertex is the average of the -intercepts of the graph.
The Graph of
Now we will see that the vertex formula holds for any parabola. Consider the function
Adding to shifts each point on the graph units upward, as shown at right. The -coordinate of the vertex will not be affected by an upward shift. Thus, the formula
for the -coordinate of the vertex still holds. We have
We find the -coordinate of the vertex by substituting into the equation for the parabola.
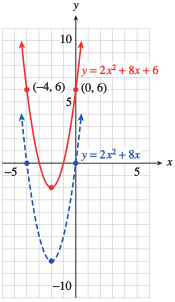
So the vertex is the point . (Notice that this point is shifted units upward from the vertex of .)
We find the -intercepts of the graph by setting equal to zero.
The -intercepts are the points and .
The -intercept of the graph is found by setting equal to zero:
You can see that the -intercept, , is just the constant term of the quadratic equation. The completed graph is shown above.
The -intercept of is the same as the value of which parameter?
_____
The -intercept of is the same as the value of which parameter?
- None of these
Find the vertex of the graph of .
_____
Decide whether the vertex is a maximum point or a minimum point of the graph._____
, minimum
Find the vertex of the graph of . Decide whether the vertex is a maximum point or a minimum point of the graph.
, minimum
Number of -Intercepts
The graph of the quadratic function
may have two, one, or no -intercepts, according to the number of distinct real-valued solutions of the equation . Consider the three functions graphed below.
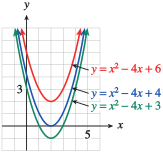
- The graph of has two -intercepts, because the equation has two real-valued solutions, and .
- The graph of has only one -intercept, because the equation has only one (repeated) real-valued solution, .
- The graph of has no -intercepts, because the equation has no real-valued solutions.
A closer look at the quadratic formula reveals useful information about the solutions of quadratic equations. For the three functions above, we have the following:
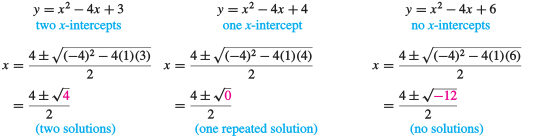
The expression , which appears under the radical in the quadratic formula, is called the discriminant, , of the equation. The value of the discriminant determines the nature of the solutions of the equation. In particular, if the discriminant is negative, the solutions of the quadratic equation are complex numbers. (We will study complex numbers in Complex Numbers.)
Use the discriminant to discover how many -intercepts the graph of each function has.
- _____
- _____
- None: the discriminant is negative.
- One: the discriminant is 0.
Use the discriminant to discover how many -intercepts the graph of each function has.
- None: the discriminant is negative.
- One: the discriminant is 0.
In Practice 5, you can check that the single -intercept is also the vertex of the parabola.
In Practice 5, you can check that the single -intercept is also the vertex of the parabola.
Explain what the discriminant tells us about a quadratic equation.
_____
Explain what the discriminant tells us about a quadratic equation.
Sketching a Parabola
Once we have located the vertex of the parabola, the -intercepts, and the -intercept, we can sketch a reasonably accurate graph. Recall that the graph should be symmetric about a vertical line through the vertex. We summarize the procedure as follows.
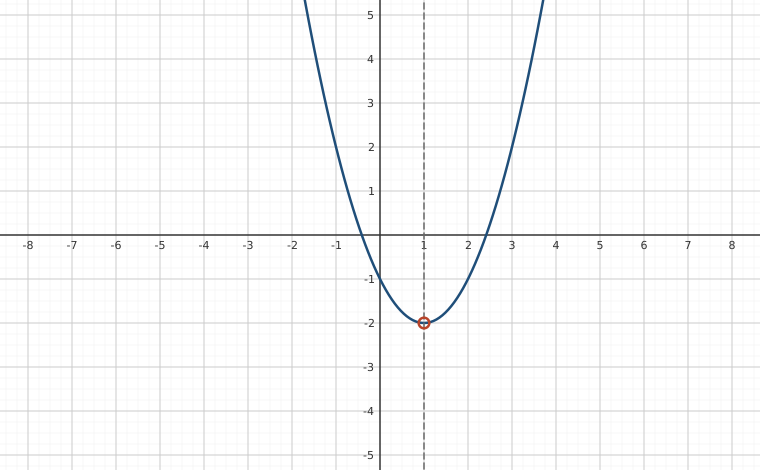
- Find the intercepts and the vertex of the graph of .
Intercepts: _____ Note: Use a comma to separate different points.
Vertex: _____ - Sketch the graph by hand.
- Use your calculator to verify your graph.
- ; , ; vertex
- A graph is below.
A graph for part (b):
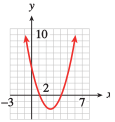
- Find the intercepts and the vertex of the graph of .
- Sketch the graph by hand.
- Use your calculator to verify your graph.
- ; , ; vertex
Which points on a parabola should you find to help you sketch its graph? Describe how to find each of these points.
_____
Which points on a parabola should you find to help you sketch its graph? Describe how to find each of these points.
Section Summary
Vocabulary
Look up the definitions of new terms in the Glossary.
- Vertex
- Conjugate pair
- Axis of symmetry
CONCEPTS
- The graph of a quadratic function is called a parabola. The values of the constants , , and determine the location and orientation of the parabola.
- For the graph of , the -coordinate of the vertex is . To find the -coordinate of the vertex, we substitute into the formula for the parabola.
- The graph of the quadratic function may have two, one, or no -intercepts, according to the number of distinct real-valued solutions of the equation .
STUDY QUESTIONS
- Sketch a parabola that opens downward. Show the location of the -intercepts, the -intercept, the vertex, and the axis of symmetry.
- Describe how the value of in alters the graph of the basic parabola.
- Describe how the value of in alters the graph of the basic parabola.
- Suppose you know that the -intercepts of a parabola are and . What is the equation of the parabola's axis of symmetry?
- State a formula for the -coordinate of the vertex of a parabola. How can you find the -coordinate of the vertex?
- Suppose that a given parabola has only one -intercept. What can you say about the vertex of the parabola?
- Explain why a quadratic equation has one (repeated) solution if its discriminant is zero, and none if the discriminant is negative.
SKILLS
Practice each skill in the Homework problems listed.
- Graph transformations of the basic parabola: #1 and 2, 7, and 8
- Locate the -intercepts of a parabola: #3–6
- Locate the vertex of a parabola: #3–6, 13, and 14
- Sketch the graph of a quadratic function: #15–24, 41, and 42
- Use the discriminant to describe the solutions of a quadratic equation: #25–40
Homework 6.3
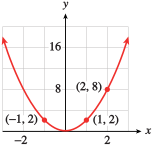
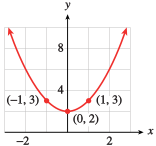
For Problems 1–2, describe what each graph will look like compared to the basic parabola. Then sketch a graph by hand and label the coordinates of three points on the graph.
- The parabola opens up, twice as steep as the standard parabola.
- The parabola is the standard parabola shifted 2 units up.
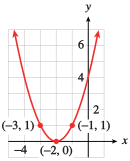
- The parabola is the standard parabola shifted 2 units left.
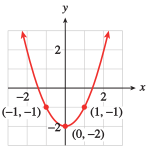
- The parabola is the standard parabola shifted 2 units down.
For problems 3–6, find the vertex and the -intercepts (if there are any) of the graph. Then sketch the graph by hand.
- Vertex ; -intercepts
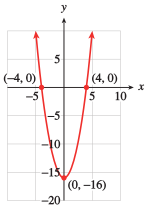
- Vertex ; -intercepts
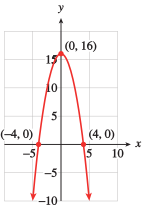
- Vertex ; -intercepts and
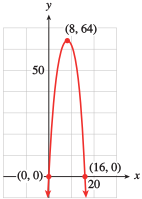
- Vertex ; -intercepts and
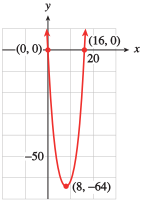
- Vertex ; -intercepts and
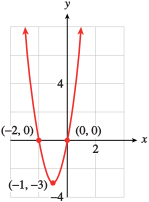
- Vertex ; -intercepts and
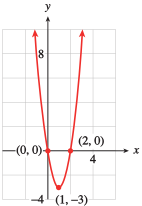
- Vertex ; no -intercepts
- Vertex ; -intercepts
Match each function with its graph. In each equation, .
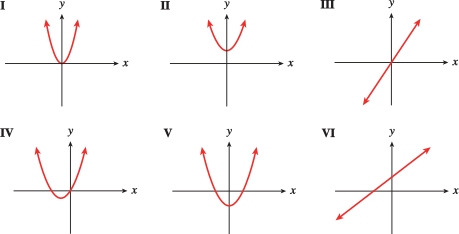
- II
- IV
- I
- III
- VI
- V
Match each function with its graph. In each equation, .
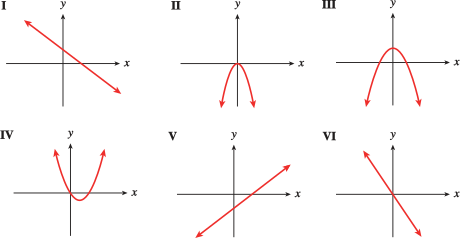
Commercial fishermen rely on a steady supply of fish in their area. To avoid overfishing, they adjust their harvest to the size of the population. The function
gives the annual rate of growth, in tons per year, of a fish population of biomass tons.
- Find the vertex of the graph. What does it tell us about the fish population?
- Sketch the graph for .
- For what values of does the fish population decrease rather than increase? Suggest a reason why the population might decrease.
- ; The largest annual increase in biomass, tons, occurs when the biomass is tons.
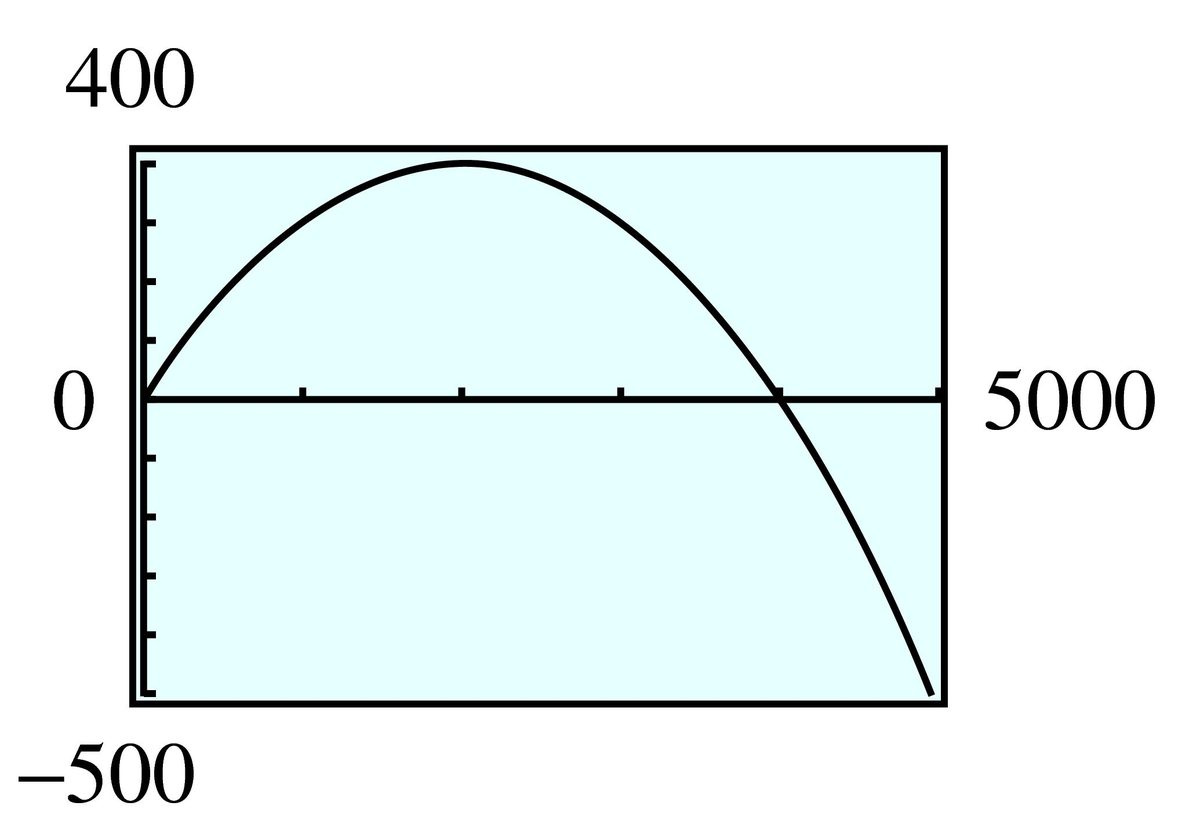
- ; When there are too many fish, there will not be enough food to support all of them.
The annual increase, , in the deer population in a national park depends on the size, , of the population that year, according to the function
- Find the vertex of the graph. What does it tell us about the deer population?
- Sketch the graph for .
- For what values of does the deer population decrease rather than increase? Suggest a reason why the population might decrease.
Many animals live in groups. A species of marmot found in Colorado lives in harems composed of a single adult male and several females with their young. The number of offspring each female can raise depends on the number of females in the harem. On average, if there are females in the harem, each female can raise young marmots each year.
- Complete the table of values for the average number of offspring per female, and the total number of young marmots, , produced by the entire harem in one year.
- Write a formula for in terms of .
- Graph as a function of .
- What is the maximum number of young marmots a harem can produce (on average)? What is the optimal number of female marmots per harem?
- or
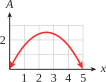
- The maximum number of young marmots, on average, is ; the optimal number of female marmots is .
Greenshield's model for traffic flow assumes that the average speed, , of cars on a highway is a linear function of the traffic density, , in vehicles per mile, given by
where is the free-flow speed and is the maximum density (the point when traffic jams). Then the traffic flow, , in vehicles per hour, is given by .
- Write a formula for as a function of .
- If the free-flow speed is mph and the maximum density is vehicles per mile, graph as a function of .
- What value of gives the maximum traffic flow? What is the average speed of vehicles at that density?
After touchdown, the distance the space shuttle travels is given by
where is the shuttle's velocity in ft/sec at touchdown, is the pilot's reaction time before the brakes are applied, and is the shuttle's deceleration.
- Graph for seconds and . Find the coordinates of the vertex and the horizontal intercepts. Explain their meaning, if any, in this context.
- The runway at Edwards Air Force base is feet long. What is the maximum velocity the shuttle can have at touchdown and still stop on the runway?
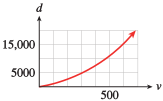
Vertex: ; Horizontal intercepts and . The point means that no distance is required to stop a plane that is not moving.- ft/sec
When setting the pump pressure at the engine, firefighters must take into account the pressure loss due to friction inside the fire hose. For every feet of hoseline, a hose of diameter inches loses pressure according to the formula
where is the water flow in hundreds of gallos per minute. The friction loss, , is measured in pounds per square inch (psi). (Source: www.hcc.hawaii.edu/~jkemmer)
- Graph on the domain .
- The firefighters have unrolled feet of -inch-diameter hose, and they would like to deliver water at a rate of gallons per minute, with nozzle pressure at psi. They must add the friction loss to the nozzle pressure to calculate the engine pressure required. What should the engine pressure be?
For Problems 15–16, find the coordinates of the vertex. Decide whether the vertex is a maximum point or a minimum point on the graph.
- , maximum
- , minimum
- , maximum
In Problems 17–26,
- Find the coordinates of the intercepts and the vertex.
- Sketch the graph by hand.
- Use your calculator to verify your graph.
- -intercepts: and ; -intercept: ; vertex:
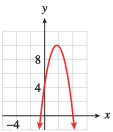
- -intercepts: and ; -intercept: ; vertex:
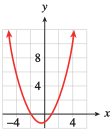
- No -intercepts; -intercept: ; vertex:
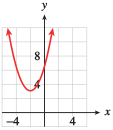
- -intercepts: ; -intercept: ; vertex:
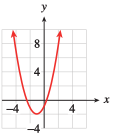
- -intercepts: ; -intercept: ; vertex:
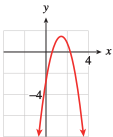
- Graph the three functions in the window Use the Trace to locate the -intercepts of each graph.
- Set for each of the equations in part (a) and calculate the discriminant. What does the discriminant tell you about the solutions of the equation? How does your answer relate to the graphs in part (a)?
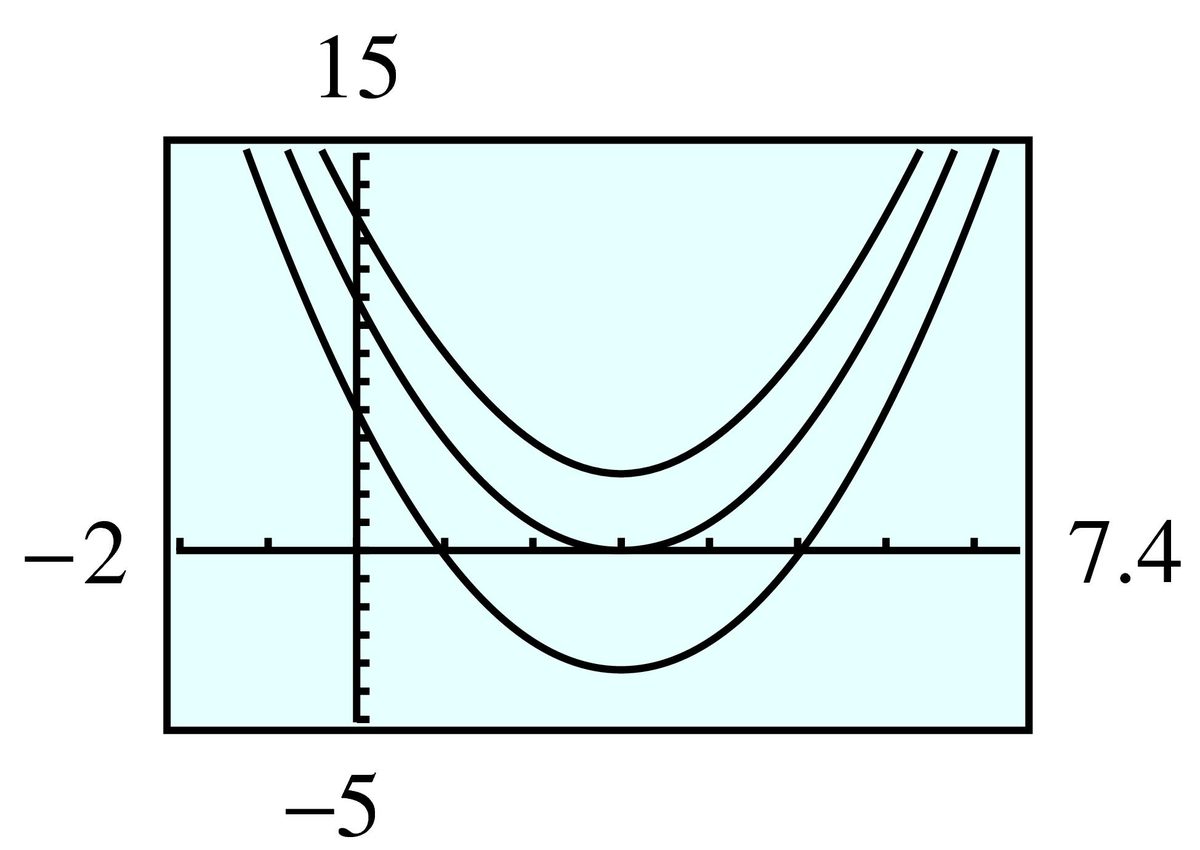
: -intercepts and ; : -intercept ; : No -intercept.- : means that there are two rational -intercepts, means that there is exactly one -intercept, means that there is no -intercept.
- Graph the three functions in the window Use the Trace to locate the -intercepts of each graph.
- Set for each of the equations in part (a) and calculate the discriminant. What does the discriminant tell you about the solutions of the equation? How does your answer relate to the graphs in part (a)?
For Problems 29–34, use the discriminant to determine the nature of the solutions of each equation.
Two complex solutions
One repeated rational solution
Two distinct real solutions
For problems 35–38, use the discriminant to decide if we can solve the equation by factoring.
No
Yes
For Problems 39–42,
- Given one solution of a quadratic equation with rational coefficients, find the other solution.
- Write a quadratic equation that has those solutions.
For Problems 43 and 44, match each equation with one of the eight graphs shown.
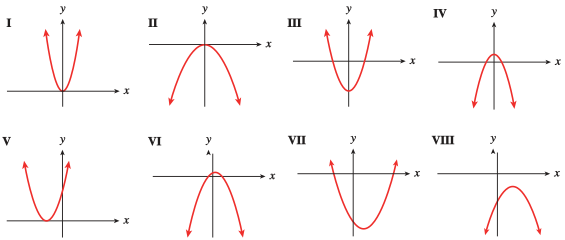
- IV
- V
- I
- VII
- Write an equation for a parabola that has -intercepts at and . What is the equation of the parabola's axis of symmetry?
- Write an equation for another parabola that has the same -intercepts. What is the equation of the parabola's axis of symmetry?
- ;
- ;
- Write an equation for a parabola that opens upward and has -intercepts at and . What is the equation of the parabola's axis of symmetry?
- Write an equation for a parabola that opens downward and has -intercepts and . What is the equation of its axis of symmetry?
- Graph the functions in the same window on your calculator:
- Find the vertex of each graph in part (a) and plot the points.
- Find the equation of the curve in part (b).
- Show that the vertex of lies on the curve for any value of .
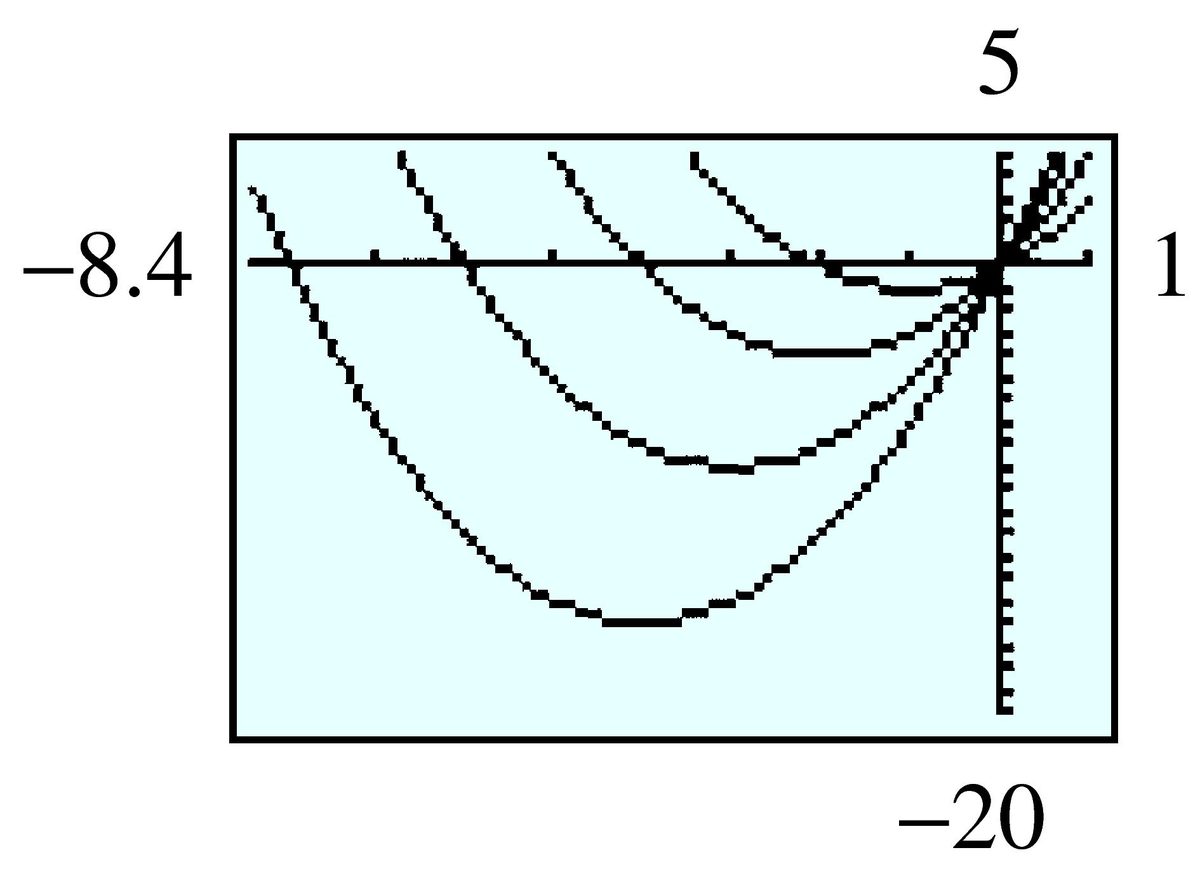
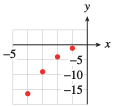
- The vertex of is
- Graph the functions in the same window on your calculator:
- Find the vertex of each graph in part (a) and plot the points.
- Find the equation of the curve in part (b).
- Show that the vertex of lies on the curve for any value of .
Because of air resistance, the path of a kicked soccer ball is not actually parabolic. However, both the horizontal and vertical coordinates of points on its trajectory can be approximated by quadratic functions. For a soccer ball kicked from the ground, these functions are
where and are given in meters and is the number of seconds since the ball was kicked.
- Fill in the table.
- Plot the points from your table and connect them with a smooth curve to represent the path of the ball.
- Use your graph to estimate the maximum height of the ball.
- Estimate the horizontal distance traveled by the ball before it strikes the ground.
- Using the formula given for , determine how long the ball is in the air.
- Use your answer from part (e) and the formula for to find the horizontal distance traveled by the ball before it strikes the ground.
- Use the formula given for to find the maximum height for the ball.
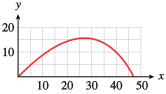
- m
- m
- sec
- m
- m
How far can you throw a baseball? The distance depends on the initial speed of the ball, , and on the angle at which you throw it. For maximum range, you should throw the ball at .
- If there were no air resistance, the height, , of the ball t seconds after its release would be given in meters by the function where is the acceleration due to gravity. Find an expression for the total time the ball is in the air. (Hint: Set and solve for in terms of the other variables.)
- At time , the ball has traveled a horizontal distance given by Find an expression for the range of the ball in terms of its velocity, . (Hint: In part (a), you found an expression for when . Use that value of to calculate when .)
- The fastest baseball pitch on record was meters per second, or about miles per hour. Use your formula from part (b) to calculate the theoretical range of such a pitch. The value of is .
- The maximum distance a baseball has actually been thrown is meters. Can you explain the discrepancy between this figure and your answer to part (c)?
Modeling, Functions, and Graphs by Katherine Yoshiwara (yoshiwarabooks.org), GNU Free Documentation License 1.2 or later. Adapted for the XYZ HTML edition with the authors' permission (recorded 2026-07-04). License: GFDL-1.2-or-later.