
6.4 Problem Solving
Many quadratic models arise as the product of two variables, one of which increases while the other decreases. For example, the area of a rectangle is the product of its length and its width, or . If we require that the rectangle have a certain perimeter, then as we increase its length, we must also decrease its width. (We analyzed this problem in Perimeter and Area of Modeling with Functions.)
For Revenue from Theater Tickets, recall the formula for the revenue from sales of an item:
Usually, when the price of an item increases, the number of items sold decreases.
Maximum or Minimum Values
Finding the maximum or minimum value for a variable expression is a common problem in many applications. For example, if you own a company that manufactures blue jeans, you might like to know how much to charge for your jeans in order to maximize your revenue.
As you increase the price of the jeans, your revenue may increase for a while. But if you charge too much for the jeans, consumers will not buy as many pairs, and your revenue may actually start to decrease. Is there some optimum price you should charge for a pair of jeans in order to achieve the greatest revenue?
The height of golf ball in meters is given by . What does the vertex of the graph tell us about the golf ball?
_____
When the golf ball reaches its maximum height
The height of golf ball in meters is given by . What does the vertex of the graph tell us about the golf ball?
- How long the golf ball is in the air
- The starting height of the golf ball
- When the golf ball reaches its maximum height
- The speed of the golf ball
The Metro Rail service sells tickets each day when it charges dollars per ticket.
- Write an equation for the revenue, , as a function of the price of a ticket.
_____ - What ticket price will return the maximum revenue?
$_____
What is the maximum revenue?
$_____
- The revenue is the product of the number of tickets times the price per ticket:
- $ $
The Metro Rail service sells tickets each day when it charges dollars per ticket.
- Write an equation for the revenue, , as a function of the price of a ticket.
- What ticket price will return the maximum revenue? What is the maximum revenue?
- The revenue is the product of the number of tickets times the price per ticket:
- ticket price: $, maximum revenue: $
Explain why revenue will probably not increase indefinitely as price increases.
_____
Explain why revenue will probably not increase indefinitely as price increases.
The Vertex Form for a Parabola
What is the -coordinate of the vertex of the parabola ?
_____
What is the -coordinate of the vertex of the parabola ?
Consider the quadratic equation
By expanding the squared expression and collecting like terms, we can rewrite the equation in standard form as
The vertex of this parabola is
and its graph is shown below.
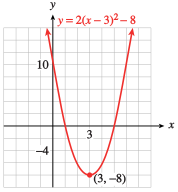
Notice that the coordinates of the vertex, , are apparent in the original equation; we don’t need to do any computation to find the vertex.
This equation is an example of the vertex form for a quadratic function.
To understand why the vertex form works, substitute into from Example to find
which confirms that when , . Next, notice that if is any number except , the expression is negative, so . Therefore, is the maximum value for on the graph, so is the high point or vertex.
You can also rewrite in standard form and use the formula to confirm that the vertex is the point .
- Find the vertex of the graph of .
Vertex: _____ - Write the equation of the parabola in standard form.
_____
- Find the vertex of the graph of .
- Write the equation of the parabola in standard form.
What is the smallest -value on the graph of ?
_____
What is the smallest -value on the graph of ?
- We can't tell without graphing
Any quadratic equation in vertex form can be written in standard form by expanding, and any quadratic equation in standard form can be put into vertex form by completing the square.
Write the equation in vertex form, and find the vertex of its graph.
The vertex form is , where
_____
_____
_____
The vertex of the graph is _____
- Factor from the variable terms.
- Complete the square inside parentheses.
- Subtract outside parentheses.
- Write the vertex form.
;
Write the equation in vertex form, and find the vertex of its graph.
- Factor from the variable terms.
- Complete the square inside parentheses.
- Subtract outside parentheses.
- Write the vertex form.
; vertex:
Why do we need to know a second point besides the vertex to find the equation of a parabola?
_____
Why do we need to know a second point besides the vertex to find the equation of a parabola?
Graphing with the Vertex Form
We can also use the vertex form to sketch a graph, using what we know about transformations.
- List the transformations of needed to graph .
- Shift 2 units _____
- Reflect about the -axis and _____ by a factor of .
- Shift 5 units _____
- Use transformations to sketch the graph.
- Shift 2 units left, reflect about -axis and compress by a factor of 2, shift 5 units up.
- A graph is below.
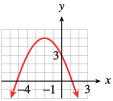
- List the transformations of needed to graph .
- Use transformations to sketch the graph.
- Shift 2 units left, reflect about -axis and compress by a factor of 2, shift 5 units up.
Systems Involving Quadratic Equations
Recall that the solution to a system of linear equations is the intersection point of the graphs of the equations. (See Algebra Review Refresher Linear Systems in Two Variables.) This is also true of systems in which one or both of the equations is quadratic. The figure below shows the three cases for systems of one quadratic and one linear equation.
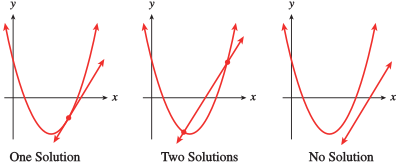
In Example, we use both graphical and algebraic techniques to solve the system.
- Solve the system algebraically:
Solutions: _____ Note: list solutions as ordered pairs, and use a comma to separate solutions. - Graph both equations, and show the solutions on the graph.
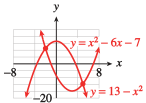
- Solve the system algebraically:
- Graph both equations, and show the solutions on the graph.
Explain how to find the intersection points of two parabolas.
_____
Explain how to find the intersection points of two parabolas.
Section Summary
Vocabulary
Look up the definitions of new terms in the Glossary.
- Maximum value
- Minimum value
- Vertex form
CONCEPTS
- Quadratic models may arise as the product of two variables.
- The maximum or minimum of a quadratic function occurs at the vertex.
- We can convert a quadratic equation to vertex form by completing the square.
- We can graph a quadratic equation in vertex form using transformations.
- A system involving quadratic equations may have one, two, or no solutions.
STUDY QUESTIONS
- How can you tell whether a variable given by a quadratic equation has a maximum value or a minimum value?
- Correct the following false statement.
- The maximum or minimum value given by a quadratic equation is the average of the -intercepts. ()
- Explain why is the smallest function value for .
- In the equation , what does each of the constants tell you about the graph?
- Francine attempts to write the equation in vertex form as follows: . What is wrong with her work?
- Without doing any calculations, solve the system . (Hint: Visualize the graphs.)
SKILLS
Practice each skill in the Homework problems listed.
- Find the maximum or minimum value of a quadratic function: #1–14
- Convert a quadratic equation from vertex form to standard form: #19–22
- Convert a quadratic equation from standard form to vertex form: #23–28
- Use transformations to graph a quadratic equation: #15–28
- USolve a system involving quadratic equations: #31–50
Homework 6.4
The owner of a motel has rooms to rent. She finds that if she charges $ per room per night, all the rooms will be rented. For every $ that she increases the price of a room, rooms will stand vacant.
- Complete the table. The first two rows are filled in for you.
No. of price
increasesPrice of
roomNo. of rooms
rentedTotal
revenue - Let stand for the number of price increases the owner makes. Write algebraic expressions for the price of a room, the number of rooms that will be rented, and the total revenue earned at that price.
- Use your calculator to make a table of values for your algebraic expressions. Let stand for the price of a room, for the number of rooms rented, and for the total revenue. Verify the values you calculated in part (a).
- Use your table to find a value of that causes the total revenue to be zero.
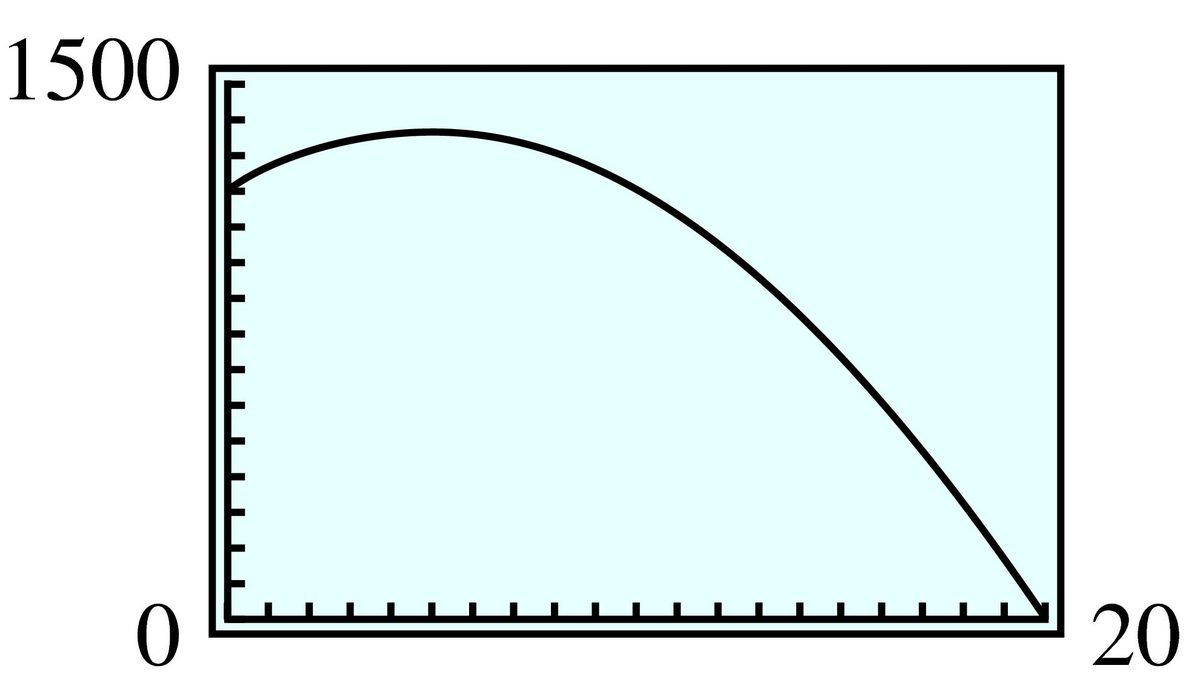
- Use your graphing calculator to graph your formula for total revenue.
- What is the lowest price that the owner can charge for a room if she wants her revenue to exceed per night? What is the highest price she can charge to obtain this revenue?
- What is the maximum revenue the owner can earn in one night? How much should she charge for a room to maximize her revenue? How many rooms will she rent at that price?
No. of price
increasesPrice of
roomNo. of rooms
rentedTotal
revenue- Price of a room: ; Rooms rented: ; Revenue:
- $ $
- $ $ rooms
The owner of a video store sells blank tapes per week if he charges per tape. For every he increases the price, he sells fewer tapes per week.
- Complete the table. The first two rows are filled in for you.
No. of price
increasesPrice of
tapeNo. of tapes
soldTotal
revenue - Let stand for the number of price increases the owner makes. Write algebraic expressions for the price of a tape, the number of tapes sold, and the total revenue.
- Use your calculator to make a table of values for your algebraic expressions. Let stand for the price of a tape, for the number of tapes sold, and for the total revenue. Verify the values you calculated in part (a).
- Use your table to find a value of that causes the total revenue to be zero.
- Use your graphing calculator to graph your formula for total revenue.
- How much should the owner charge for a tape in order to bring in per week from tapes? (You should have two answers.)
- What is the maximum revenue the owner can earn from tapes in one week? How much should he charge for a tape to maximize his revenue? How many tapes will he sell at that price?
- Give the dimensions of two different rectangles with perimeter meters. Compute the areas of the two rectangles.
- A rectangle has a perimeter of meters. If the length of the rectangle is meters, write an expression for its width.
- Write an expression for the area of the rectangle.
- (For example) m by m with area sq m; or m by m, area sq m
- Give the dimensions of two different rectangles with perimeter inches. Compute the areas of the two rectangles.
- A rectangle has a perimeter of inches. If the width of the rectangle is inches, write an expression for its length.
- Write an expression for the area of the rectangle.
For Problems 5–8,
- Find the maximum or minimum value algebraically.
- Obtain a good graph on your calculator and verify your answer. (Use the coordinates of the vertex and the vertical intercept to help you choose an appropriate window for the graph.)
Delbert launches a toy water rocket from ground level. Its distance above the ground seconds after launch is given, in feet, by
When will the rocket reach its greatest height, and what will that height be?
sec, ft
Francine throws a wrench into the air from the bottom of a trench feet deep. Its height seconds later is given, in feet, by
When will the wrench reach its greatest height, and what will that height be?
The owners of a small fruit orchard decide to produce gift baskets as a sideline. The cost per basket for producing baskets is
How many baskets should they produce in order to minimize the cost per basket? What will their total cost be at that production level?
baskets,
A new electronics firm is considering marketing a line of telephones. The cost per phone for producing telephones is
How many telephones should the firm produce in order to minimize the cost per phone? What will the firm's total cost be at that production level?
As part of a collage for her art class, Sheila wants to enclose a rectangle with inches of yarn.
- Let represent the width of the rectangle, and write an expression for its length. Then write an expression that gives the area, , of the rectangle as a function of its width, .
- What is the area of the largest rectangle that Sheila can enclose with inches of yarn?
- Length: ; Area:
- sq in
Gavin has rented space for a booth at the county fair. As part of his display, he wants to rope off a rectangular area with yards of rope.
- Let represent the width of the roped-off rectangle, and write an expression for its length. Then write an expression that gives the area, , of the roped-off space as a function of its width, .
- What is the largest area that Gavin can rope off? What will the dimensions of the rectangle be?
A farmer plans to fence a rectangular grazing area along a river with 300 yards of fence as shown in the figure.
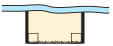
- Write an expression that gives the area, , of the grazing land as a function of the width, , of the rectangle.
- What is the largest area the farmer can enclose?
- sq yd
A breeder of horses wants to fence two rectangular grazing areas along a river with meters of fence as shown in the figure.
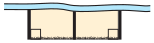
- Write an expression that gives the area, , of the grazing land as a function of the width, , of the rectangles.
- What is the largest area the breeder can enclose?
A travel agent offers a group rate of per person for a week in London if people sign up for the tour. For each additional person who signs up, the price per person is reduced by .
- Let represent the number of additional people who sign up. Write expressions for the total number of people signed up, the price per person, and the total revenue.
- How many people must sign up for the tour in order for the travel agent to maximize her revenue?
- Number of people: ; Price per person: ; Total revenue:
An entrepreneur buys an apartment building with units. The previous owner charged per month for a single apartment and on the average rented apartments at that price. The entrepreneur discovers that for every he raises the price, another apartment stands vacant.
- Let represent the number of price increases. Write expressions for the new price, the number of rented apartments, and the total revenue.
- What price should the entrepreneur charge for an apartment in order to maximize his revenue?
During a statistical survey, a public interest group obtains two estimates for the average monthly income of young adults aged 18 to 25. The first estimate is and the second estimate is . To refine its estimate, the group will take a weighted average of these two figures:
To get the best estimate, the group must choose to minimize the function
(The numbers that appear in this expression reflect the variance of the data, which measures how closely the data cluster around the mean, or average.) Find the value of that minimizes , and use this value to get a refined estimate for the average income.
;
The rate at which an antigen precipitates during an antigen-antibody reaction depends upon the amount of antigen present. For a fixed quantity of antibody, the time required for a particular antigen to precipitate is given in minutes by the function
where is the quantity of antigen present, in grams. For what quantity of antigen will the reaction proceed most rapidly, and how long will the precipitation take?
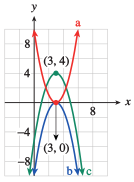
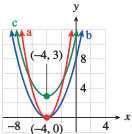
For Problems 17–20, use transformations to graph the parabola. What is the vertex of each graph?
In Problems 21–24,
- Find the vertex of the parabola.
- Use transformations to sketch the graph.
- Write the equation in standard form.
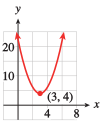
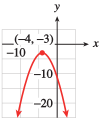
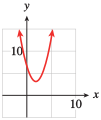
For Problems 25–30,
- Write each equation in the form by completing the square.
- Using horizontal and vertical translations, sketch the graph by hand.
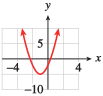
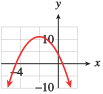
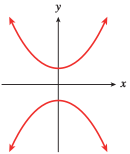
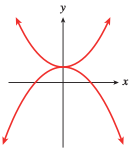
A system of two quadratic equations may have no solution, one solution, or two solutions. Sketch a system illustrating each case. In your sketches, one of the parabolas should open up, and the other down.
No solutions:
One solution:
Two solutions:
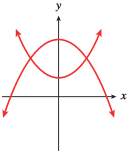
A system of two quadratic equations may have no solution, one solution, or two solutions. Sketch a system illustrating each case. In your sketches, both parabolas should open up.
For Problems 33–44, solve the system algebraically. Use your calculator to graph both equations and verify your solutions.
No solution
Problems 45–48 deal with wildlife management and sustainable yield.
In Problem of Graphing Parabolas, you graphed the annual growth rate of a population of fish,
where is the current biomass of the population, in tons.
- Suppose that fishermen harvest tons of fish each year. Sketch the graph of on the same axes with your graph of .
- If the biomass is currently tons and tons are harvested, will the population be larger or smaller next year? By how much? What if the biomass is currently tons?
- What sizes of biomass will remain stable from year to year if tons are harvested annually?
- If the biomass ever falls below tons, what will happen after several years of harvesting tons annually?
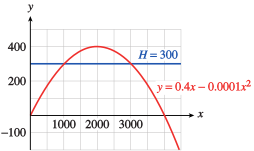
- Larger, by tons. Smaller, by tons.
- tons and tons
- The fish population will decrease each year until it is completely depleted.
In Problem of Graphing Parabolas, you graphed the annual increase, , in the deer population in a national park,
where is the current population.
- Suppose hunters are allowed to kill deer per year. Sketch the graph of on the same axes with a graph of .
- What sizes of deer populations will remain stable from year to year if deer are hunted annually?
- Suppose deer are killed annually. What sizes of deer populations will remain stable?
- What is the largest annual harvest that still allows for a stable population? (This harvest is called the maximum sustainable yield.) What is the stable population?
- What eventually happens if the population falls below the stable value but hunting continues at the maximum sustainable yield?
The annual increase, , in a bear population of size is given by
if the bears are not hunted. The number of bears killed each year by hunters is related to the bear population by the equation . (Notice that in this model, hunting is adjusted to the size of the bear population.)
- Sketch the graphs of and on the same axes.
- When the bear population is , which is greater, or ? Will the population increase or decrease in the next year? By how many bears?
- When the bear population is , will the population increase or decrease in the next year? By how many bears?
- What sizes of bear population will remain stable after hunting?
- What sizes of bear populations will increase despite hunting? What sizes of populations will decrease?
- Toward what size will the population tend over time?
- Suppose hunting limits are raised so that . Toward what size will the population tend over time?
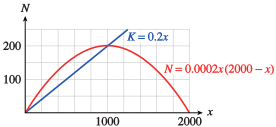
- . The population will decrease by bears.
- The population will increase by bears.
- Populations between and will increase; populations over will decrease.
- (unless the population is )
- (unless the population is )
The annual increase in the biomass of a whale population is given in tons by
where is the current population, also in tons.
- Sketch a graph of for . What size biomass remains stable?
- Each year hunters are allowed to harvest a biomass given by . Sketch on the same graph with . What is the stable biomass with hunting?
- What sizes of populations will increase despite hunting? What sizes will decrease?
- What size will the population approach over time? What biomass are hunters allowed to harvest for that size population?
- Find a value of so that the graph of will pass through the vertex of .
- For the value of found in part (e), what size will the population approach over time? What biomass are hunters allowed to harvest for that size population?
- Explain why the whaling industry should prefer hunting quotas of rather than for a long-term strategy, even though for any positive value of .
For Problems 49–52,
- Find the break-even points by solving a system of equations.
- Graph the equations for Revenue and Cost in the same window and verify your solutions on the graph.
- Use the fact that to find the value of for which profit is maximum.
Writewell, Inc. makes fountain pens. It costs Writewell
dollars to manufacture pens, and the company receives dollars in revenue from the sale of the pens.
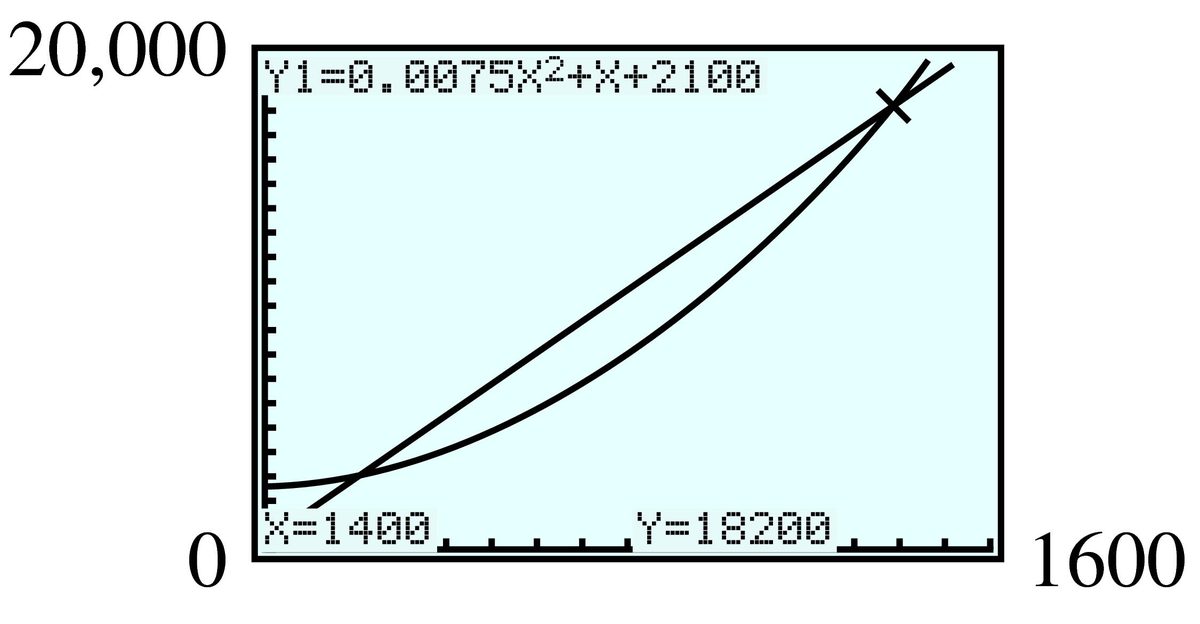
It costs The Sweetshop
dollars to produce pounds of chocolate creams. The company brings in dollars revenue from the sale of the chocolates.
It costs an appliance manufacturer
dollars to produce front-loading washing machines, which will then bring in revenues of dollars.
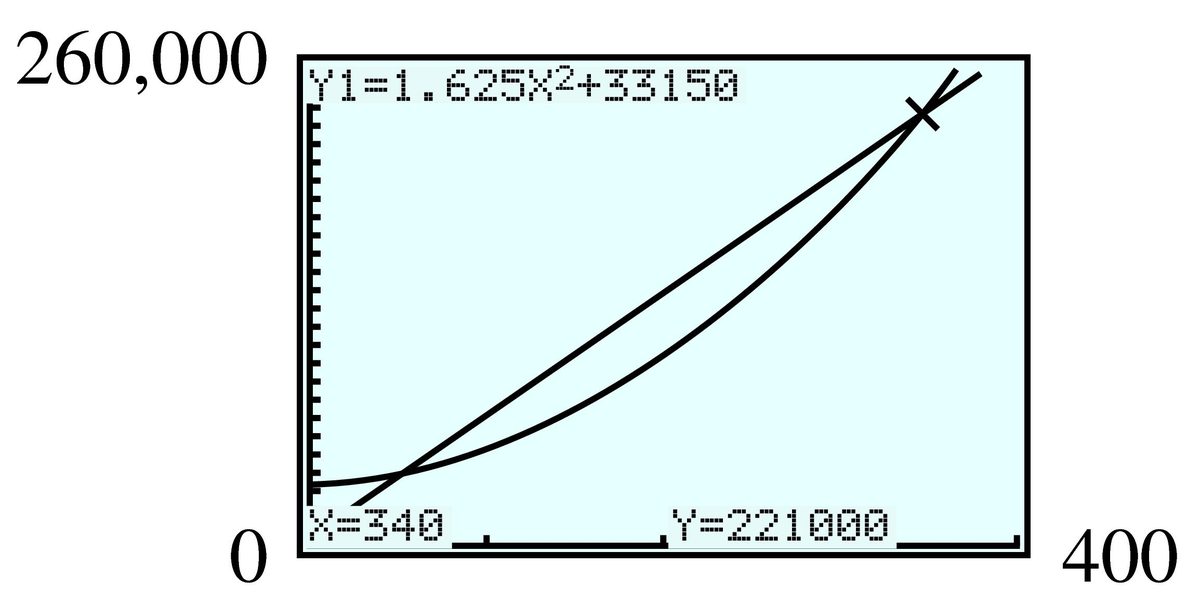
A company can produce lawn mowers for a cost of
dollars. The sale of the lawn mowers will generate dollars in revenue.
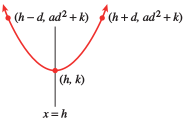
Problems 53 and 54 prove that the vertical line is the axis of symmetry of the graph of . A graph is symmetric about the line if the point lies on the graph whenever the point lies on the graph.
- Sketch a parabola and the line . We will show that the parabola is symmetric about the line .
- Label a point on the parabola with -coordinate , where . What is the -coordinate of that point?
- Label the point on the parabola with -coordinate . What is the -coordinate of that point?
- Explain why your answers to parts (b) and (c) prove that the line is the axis of symmetry for the graph of .
- See graph and (c)
- The two points on the parabola that are the same horizontal distance from the line the axis of symmetry have the same -coordinate, so they are symmetric about that line.
To find the axis of symmetry for the graph of , we will use the results of Problem 51 and the technique of completing the square.
- Write the equation in vertex form by completing the square. (Follow the steps in Example.)
- Your answer to part (a) has the form . What is your value of ? What is your value of ?
- What is the axis of symmetry for the parabola ?
Modeling, Functions, and Graphs by Katherine Yoshiwara (yoshiwarabooks.org), GNU Free Documentation License 1.2 or later. Adapted for the XYZ HTML edition with the authors' permission (recorded 2026-07-04). License: GFDL-1.2-or-later.