
2.3 Transformations of Graphs
Models for real situations are often variations of the basic functions introduced in Some Basic Functions. In this section, we explore how certain changes in the formula for a function affect its graph. In particular, we will compare the graph of with the graphs of
for different values of the constants , , and . Such variations are called transformations of the graph.
Vertical Translations
The figure below shows the graphs of , , and the basic parabola, . By comparing tables of values, we can see exactly how the graphs of and are related to the basic parabola.
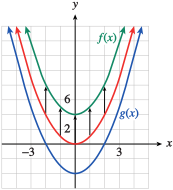
Each -value in the table for is four units greater than the corresponding -value for the basic parabola. Consequently, each point on the graph of is four units higher than the corresponding point on the basic parabola, as shown by the arrows. Similarly, each point on the graph of is four units lower than the corresponding point on the basic parabola.
The graphs of and are said to be translations of the graph of . They are shifted to a different location in the plane but retain the same size and shape as the original graph. In general, we have the following principles.
The graph of has a vertical asymptote at . What happens to the asymptote under a vertical translation?
_____
Nothing: a vertical asymptote does not change when a graph undergoes a vertical translation.
The graph of has a vertical asymptote at . What happens to the asymptote under a vertical translation?
- Nothing.
- It is compressed vertically.
- It is translated vertically.
- It is eliminated.
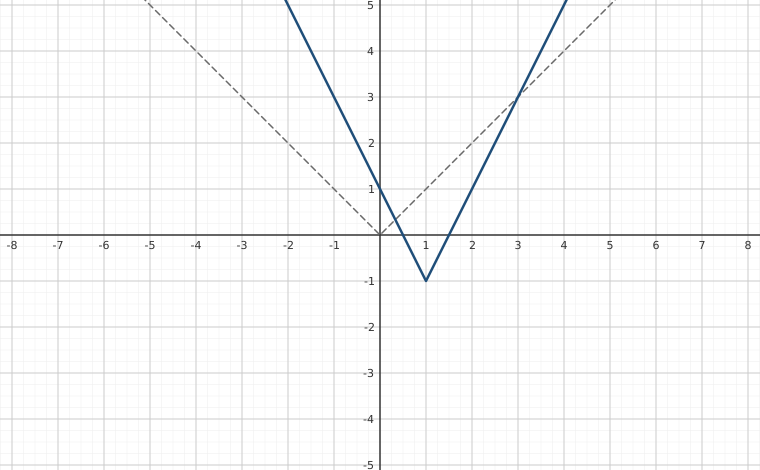
- Graph the function .
- How is the graph of different from the graph of ?
To get the graph of ,
_____
- A graph is below.
- Translate one unit up.
A graph for part (a) is below.
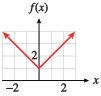
- Graph the function .
- How is the graph of different from the graph of ?
- The graph of is translated one unit up.
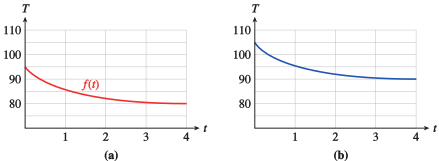
An evaporative cooler, or swamp cooler, is an energy-efficient type of air conditioner used in dry climates. A typical swamp cooler can reduce the temperature inside a house by 15 degrees.
Figure (a) shows the graph of , the temperature inside Kate's house hours after she turns on the swamp cooler. Write a formula in terms of for the function shown in figure (b), and give a possible explanation of its meaning.
_____
_____
. The outside temperature was hotter.
An evaporative cooler, or swamp cooler, is an energy-efficient type of air conditioner used in dry climates. A typical swamp cooler can reduce the temperature inside a house by 15 degrees.
Figure (a) shows the graph of , the temperature inside Kate's house hours after she turns on the swamp cooler. Write a formula in terms of for the function shown in figure (b), and give a possible explanation of its meaning.
. The outside temperature was hotter.
Horizontal Translations
Now consider the graphs of
shown below. Compared with the graph of the basic function , the graph of is shifted two units to the left, as shown by the arrows.
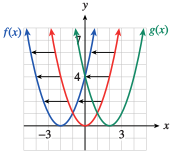
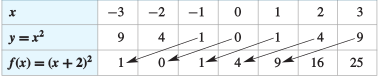
You can see why this happens by studying the function values in the table.
Locate a particular -value for , say, . You must move two units to the left in the table to find the same -value for , as shown by the arrow. In fact, each -value for occurs two units to the left when compared to the same -value for .
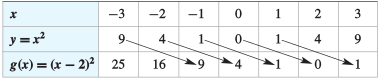
Similarly, the graph of is shifted two units to the right compared to the graph of . In the table for , each -value for occurs two units to the right of the same -value for . In general, we have the following principle.
The -intercept of the graph of is . What point lies on the graph of ?
_____
lies on the graph of .
The -intercept of the graph of is . What point lies on the graph of ?
- Graph the function .
- How is the graph of different from the graph of ?
_____
- A graph is shown below.
- Translate one unit left.
A graph for part (a) is shown below.
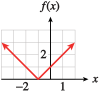
- Graph the function .
- How is the graph of different from the graph of ?
- The graph of is translated one unit to the left.
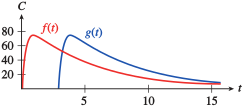
The function shown above gives the caffeine level in Delbert's bloodstream at time hours after he drinks a cup of coffee, and gives the caffeine level in Francine's bloodstream. Write a formula for in terms of , and explain what it tells you about Delbert and Francine.
_____
_____
. Francine drank her coffee hours after Delbert drank his.
The function shown below gives the caffeine level in Delbert's bloodstream at time hours after he drinks a cup of coffee, and gives the caffeine level in Francine's bloodstream. Write a formula for in terms of , and explain what it tells you about Delbert and Francine.
. Francine drank her coffee hours after Delbert drank his.
- Graph the function .
- How is the graph of different from the graph of ?
_____
- A graph is shown below.
- Translate one unit down and two units right.
A graph for part (a):
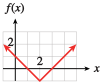
- Graph the function .
- How is the graph of different from the graph of ?
- It is translated one unit down and two units to the right from the graph of .
Horizontal translations are less intuitive than vertical translations. What explanation helps you understand them?
_____
Horizontal translations are less intuitive than vertical translations. What explanation helps you understand them?
Scale Factors
We have seen that adding a constant to the expression defining a function results in a translation of its graph. What happens if we multiply the expression by a constant? Consider the graphs of the functions
shown below, and compare each to the graph of .
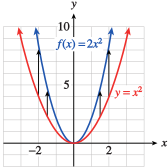
Compared to the graph of , the graph of is expanded, or stretched, vertically by a factor of . The -coordinate of each point on the graph has been doubled, as you can see in the table of values, so each point on the graph of is twice as far from the -axis as its counterpart on the basic graph .
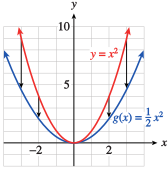
The graph of is compressed vertically by a factor of ; each point is half as far from the -axis as its counterpart on the graph of .
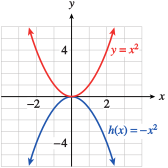
The graph of is flipped, or reflected, about the -axis; the -coordinate of each point on the graph of is replaced by its opposite.
In general, we have the following principles.
The constant is called the scale factor for the graph.
The graph of is symmetric about the -axis. Which of the following graphs is also symmetric about the -axis?
_____
Both (a) and (b)
The graph of is symmetric about the -axis. Which of the following graphs is also symmetric about the -axis?
- Both (a) and (b)
- Graph the function .
- How is the graph of different from the graph of ?
_____
- A graph is shown below.
- Stretch vertically by a factor of 2 to obtain the graph of .
A graph for part (a):

- Graph the function .
- How is the graph of different from the graph of ?
- Stretch the graph of vertically by a factor of 2 to obtain the graph of .
Under which transformations does the graph of a function keep the same shape?
_____
The graph of a function keep the same shape under all of these transformations.
Under which transformations does the graph of a function keep the same shape?
- Vertical translation
- Horizontal translation
- Reflection
- All of these
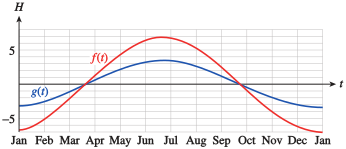
If the Earth were not tilted on its axis, there would be 12 daylight hours every day all over the planet. But in fact, the length of a day in a particular location depends on the latitude and the time of year.
The graph above shows , the length of a day in Helsinki, Finland, days after January 1, and , the length of a day in Rome. Each is expressed as the number of hours greater or less than 12. Write a formula for in terms of .
_____
What does this formula tell you?
On any given day, the number of daylight hours varies from 12 hours by about...
_____
. On any given day, the number of daylight hours varies from hours about twice as much in Helsinki as it does in Rome.
If the Earth were not tilted on its axis, there would be 12 daylight hours every day all over the planet. But in fact, the length of a day in a particular location depends on the latitude and the time of year.
The graph above shows , the length of a day in Helsinki, Finland, days after January 1, and , the length of a day in Rome. Each is expressed as the number of hours greater or less than 12. Write a formula for in terms of . What does this formula tell you?
. On any given day, the number of daylight hours varies from hours about twice as much in Helsinki as it does in Rome.
In this section we did not consider reflections about the -axis. Can you think of a way to alter the formula for to reflect the graph about the -axis? Which of the eight basic graphs would not be affected by such a reflection?
_____
In this section we did not consider reflections about the -axis. Can you think of a way to alter the formula for to reflect the graph about the -axis? Which of the eight basic graphs would not be affected by such a reflection?
Section Summary
Vocabulary
Look up the definitions of new terms in the Glossary.
- Transformation
- Scale factor
- Vertical stretch
- Vertical compression
- Horizontal translation
CONCEPTS
STUDY QUESTIONS
- How does a vertical translation affect the formula for a function? Give an example.
- How does a horizontal translation affect the formula for a function? Give an example.
- How does a scale factor affect the formula for a function? Give an example.
- How is the graph of different from the graph of ?
SKILLS
Practice each skill in the Homework problems listed.
- Write formulas for transformations of functions: #1–6, 19–22, 35–38
- Recognize and sketch translations of the basic graphs: #7–18
- Recognize and sketch expansions, compression, and reflections of the basic graphs: #23–34, 43–50
- Identify transformations from tables of values: #39–42
- Sketch graphs obtained by two or more transformations of a basic graph: #51–62
- Write a formula for a transformation of a graph: #63–76
- Interpret transformations of graphs in context: #71–76
Homework 2.3
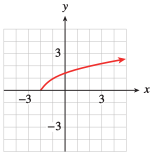
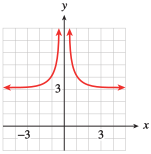
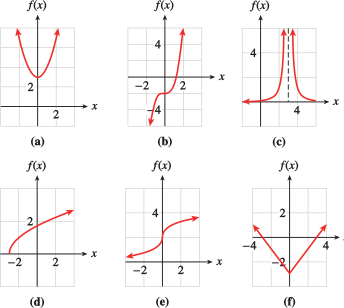
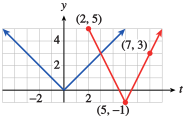
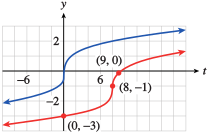
In Problems 1–6, identify the graph as a translation of a basic function, and write a formula for the graph.
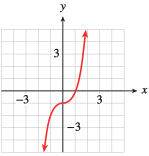
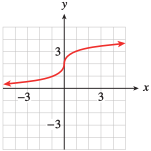
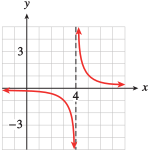
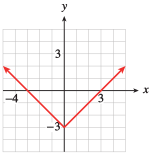
For Problems 7–18,
- Describe how to transform one of the basic graphs to obtain the graph of the given function.
- Using guidepoints, sketch the basic graph and the graph of the given function on the same axes. Label the coordinates of three points on the graph of the given function.
- Translate by units down.
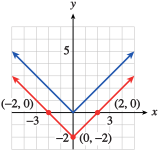
- Translate by units right.
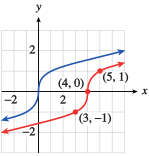
- Translate by unit up.
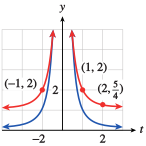
- Translate by units left.
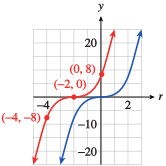
- Translate by units down.
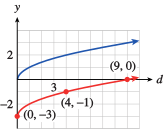
- Translate by units left.
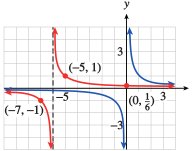
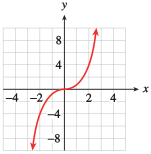
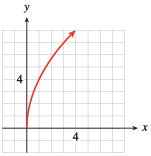
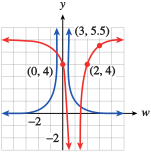
For Problems 19–22, identify the graph as a stretch, compression, or reflection of a basic function, and write a formula for the graph.
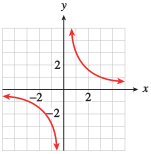
A vertical stretch by a factor of :
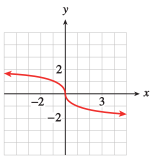
A vertical compression, the scale factor is :
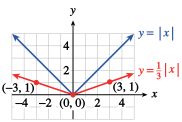
For Problems 23–32,
- Identify the scale factor for each function and describe how it affects the graph of the corresponding basic function.
- Using guidepoints, sketch the basic graph and the graph of the given function on the same axes. Label the coordinates of three points on the graph of the given function.
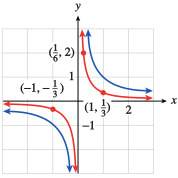
- Scale factor ; is compressed vertically by the scale factor.
- Scale factor ; is reflected over the -axis and stretched vertically by a factor of .
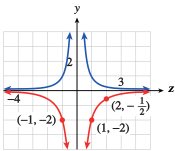
- Scale factor ; is reflected over the -axis and stretched vertically by a factor of .
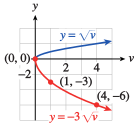
- Scale factor ; is reflected over the -axis and compressed vertically by a factor of .
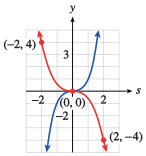
- Scale factor ; is compressed vertically by the scale factor.
In Problems 33 and 34, match each graph with its equation.
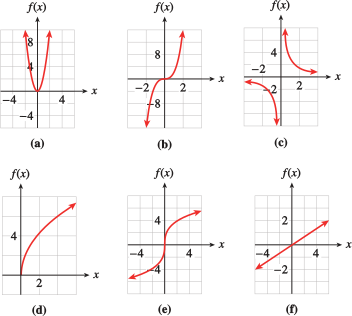
- vi
- ii
- iv
- i
- v
- iii
In Problems 35–38, the graph of a function is shown. Describe each transformation of the graph; then give a formula for each in terms of the original function.
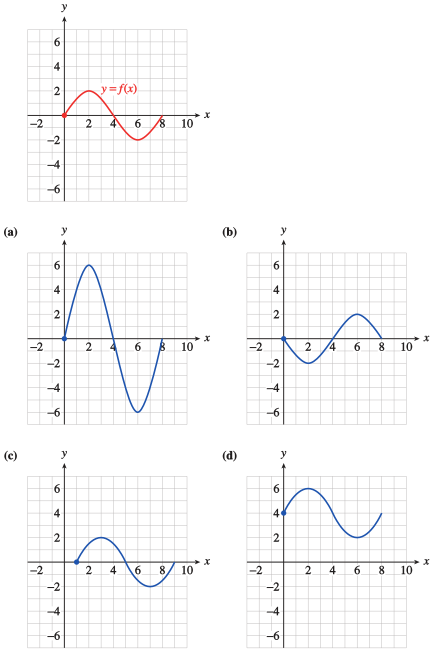
- Vertical stretch by a factor of :
- Reflection about the -axis:
- Translation unit right:
- Translation units up:
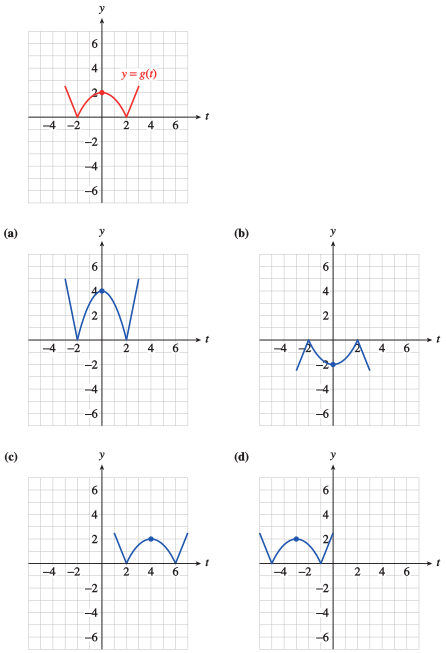
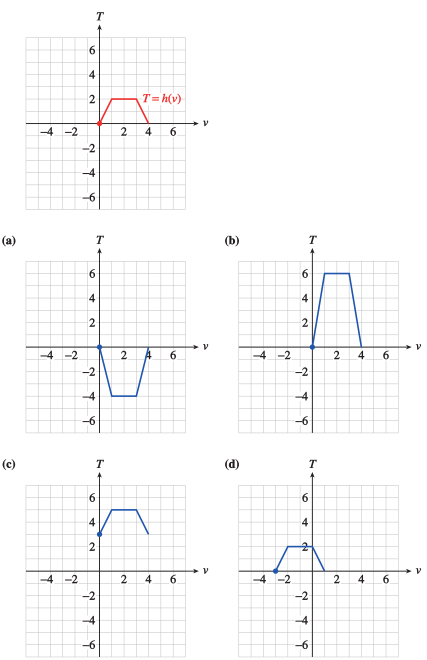
- Reflection about the -axis and vertical stretch by a factor of :
- Vertical stretch by a factor of :
- Translation units up:
- Translation units left:
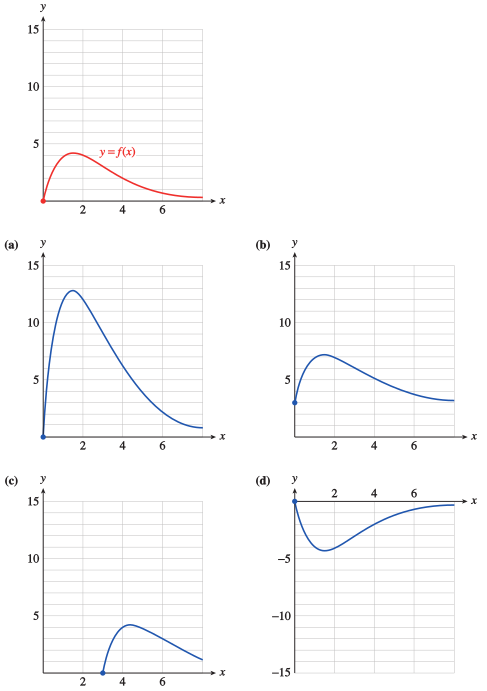
In Problems 39–42, each table in parts (a)–(d) describes a transformation of . Identify the transformation and write a formula for the new function in terms of .
- Translation units up:
- Translation units down:
- Vertical compression by a factor of :
- Translation unit right:
- Translation unit right:
- Part (a) is translated units up:
- is reflected about the -axis and stretched vertically by a factor of :
- Part (c) is translated units down:
For Problems 43–50, write the function in the form , where is one of the basic functions. Describe how the graph differs from that of the basic function.
is a vertical compression with factor of .
is a vertical stretch with factor of .
is a vertical stretch with factor of .
is a vertical compression with factor of .
For Problems 51–62,
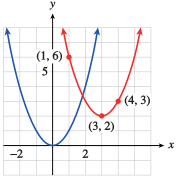
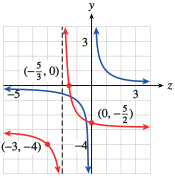
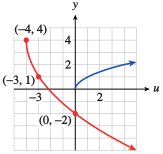
- The graph of each function can be obtained from one of the basic graphs by two or more transformations. Describe the transformations.
- Sketch the basic graph and the graph of the given function by hand on the same axes. Label the coordinates of three points on the graph of the given function.
- Translation by units up and units right
- Translation by units left and units down.
- Reflection across the -axis, vertical stretch by a factor of , translation by units left and units up
- Vertical stretch by a factor of , translation by units right and down
- Reflection across the -axis, vertical stretch by a factor of , translation by units up and unit right
- Translation by units right and unit down
In Problems 63 and 64, each graph can be obtained by two transformations of the given graph. Describe the transformations and write a formula for the new graph in terms of f.
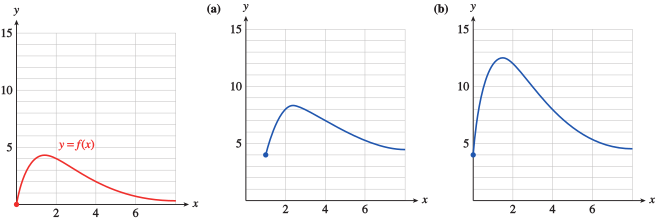
- Translation by units up and unit right:
- Vertical stretch by a factor of and a translation by units up:
For Problems 65–70,
- Describe the graph as a transformation of a basic function.
- Give an equation for the function shown.
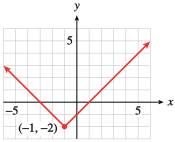
- translated by unit left and units down
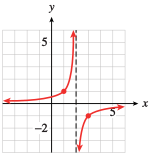
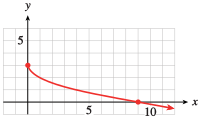
- reflected about the -axis and shifted units up
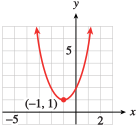
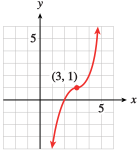
- translated by units right and unit up
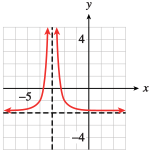
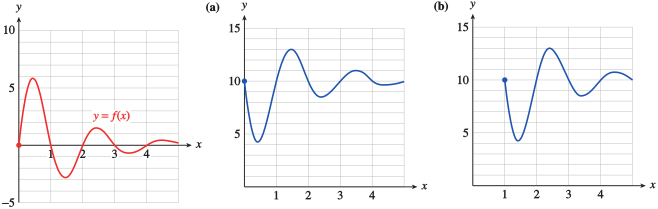
The graph of shows the number of students in Professor Hilbert's class who scored points on a quiz. Write a formula for each transformation of ((a) and (b) of the figure below); then explain how the quiz results in that class compare to the results in Professor Hilbert's class.
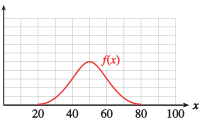
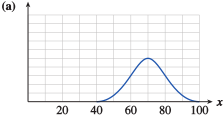
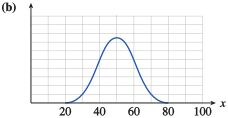
- : Students scored points higher than Professor Hilbert's class.
- : The class is about larger than Hilbert's, but the classes scored the same.
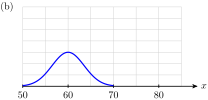
The graph of shows the number of men at Tyler College who are inches tall. Write a formula for each transformation of ; then explain how the heights in that population compare to the Tyler College men.
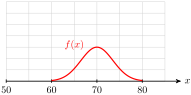
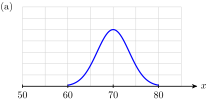
The graph of shows the California state income tax rate, in percent, for a single taxpayer whose annual taxable income is dollars. Write a formula for each transformation of ; then explain what it tells you about the income tax scheme in that state.
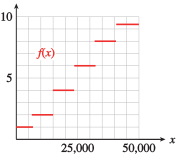
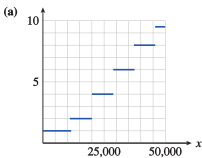
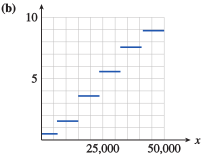
- : Taxpayers earn $ more than Californians in each tax rate
- : Taxpayers pay less tax than Californians on the same income.
The graph of shows the shipping rate at SendIt for a package that weighs pounds. Write a formula for each transformation of and explain how the shipping rates compare to the rates at SendIt.
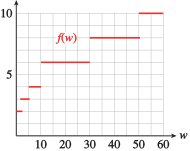
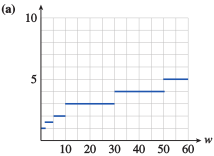
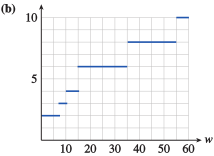
The graph of shows the population of marmots in a national park months after January 1. Write a formula for each transformation of and explain how the population of that species compares to the population of marmots.
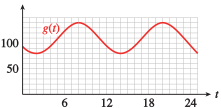
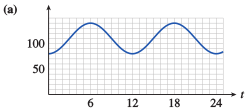
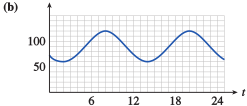
- : This population has its maximum and minimum two months before the marmots.
- : This population remains fewer than that of the marmots.
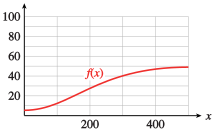
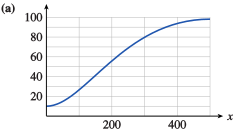
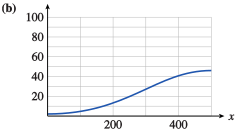
The graph of is a dose-response curve. It shows the intensity of the response to a drug as a function of the dosage milligrams administered. The intensity is given as a percentage of the maximum response. Write a formula for each transformation of and explain what it tells you about the response to that drug
Modeling, Functions, and Graphs by Katherine Yoshiwara (yoshiwarabooks.org), GNU Free Documentation License 1.2 or later. Adapted for the XYZ HTML edition with the authors' permission (recorded 2026-07-04). License: GFDL-1.2-or-later.