
8.4 Linear Inequalities
In this section, we study linear inequalities in two variables and how they arise in applications.
Graphs of Inequalities in Two Variables
Ivana is investing in the hotel business. She has bought two hotels, and she will expand her investments when her total profit from the two hotels exceeds . If we let represent the profit from one hotel and let represent the profit from the other, then Ivana will expand her investments when
Notice that the equation is not appropriate to model our situation, since Ivana will be delighted if her profits are not exactly equal to but actually exceed that amount.
A solution to an inequality in two variables is an ordered pair of numbers that satisfies the inequality. The graph of the inequality must show all the points whose coordinates are solutions. As an example, let us graph the inequality above, .
Rewrite the inequality by subtracting from both sides to get
This inequality says that for each -value, we must choose points with -values greater than or equal to . For example, when , we must choose points with -values greater than or equal to . Solutions for several choices of are shown in figure (a).
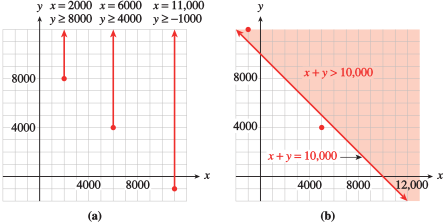
A more efficient way to find all the solutions of the inequality is to start with the graph of the corresponding equation
The graph is a straight line, as illustrated in figure (b). Observe that any point above this line has a y-coordinate greater than and hence satisfies the inequality. Thus, the graph of the inequality includes all the points on or above the line , as shown by the shaded region in figure (b).
You can check that the shaded points are also solutions to the original inequality, . Consider the point , which lies in the shaded region above the line. This pair does satisfy , because
(Ivana will expand her investments if her first hotel loses $ and her second has a profit of $.) On the other hand, the point does not lie in the graph of , because the coordinates do not satisfy the inequality.
Linear Inequalities
A linear inequality can be written in the form
The solutions consist of the line and a half-plane on one side of that line. We shade the half-plane to show that all its points are included in the solution set. If the inequality is strict, then the graph includes only the half-plane and not the line. In that case, we use a dashed line for the graph of the equation to show that it is not part of the solution.
To decide which side of the line to shade, we can solve the inequality for in terms of . If we obtain
then we shade the half-plane above the line. If the inequality is equivalent to
then we shade the half-plane below the line.
- Find one -value that satisfies the inequality for each of the -values in the table.
_____ _____ _____ - Graph the line . Then plot your solutions from part (a) on the same grid.
- Graph the solutions of the inequality .
(Many answers are possible.)- A graph is below.
- See graph.
Graph for (b) and (c):
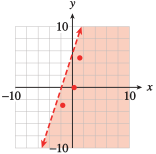
- Find one -value that satisfies the inequality for each of the -values in the table.
- Graph the line . Then plot your solutions from part (a) on the same grid.
- Graph the solutions of the inequality .
- See graph.
The solutions of all lie to which side of the boundary line?
_____
To the right
The solutions of all lie to which side of the boundary line?
- Above
- Below
- To the left
- To the right
Using a Test Point
A second method for graphing inequalities does not require us to solve for . Once we have graphed the boundary line, we can decide which half-plane to shade by using a test point. The test point can be any point that is not on the boundary line itself.
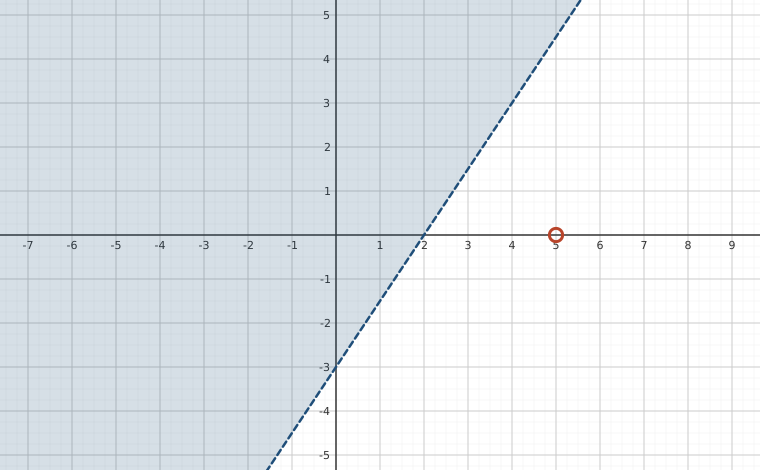
We can choose any point for the test point as long as it does not lie on the boundary line. We chose in Example because the coordinates are easy to substitute into the inequality. If the test point is a solution to the inequality, then the half-plane including that point should be shaded. If the test point is not a solution to the inequality, then the other half-plane should be shaded.
For example, suppose we had chosen as the test point in Example. When we substitute its coordinates into the inequality, we find
which is a false statement. This tells us that is not a solution to the inequality, so the solutions must lie on the other side of the boundary line. Using as the test point gives us the same solutions we found in Example.
Which point would not be a good test point for the inequality ?
_____
would not be a good test point because it lies on the boundary line.
Which point would not be a good test point for the inequality ?
Here is a summary of our test point method for graphing inequalities.
Graph the solutions of the inequality
- Graph the line . (Use the slope-intercept method.)
- Choose a test point. (Do not choose !)
- Decide which side of the line to shade. _____
- Should the boundary line be dashed or solid? _____
- A graph is below.
- Choose any point not on the boundary line .
- Shade above the boundary line.
- Use a dashed boundary line because the inequality is strict.
Graph of inequality:
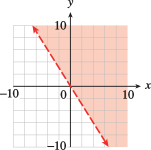
Graph the solutions of the inequality
- Graph the line . (Use the slope-intercept method.)
- Choose a test point. (Do not choose !)
- Decide which side of the line to shade.
- Should the boundary line be dashed or solid?
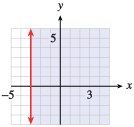
Recall that the equation of a vertical line has the form
where is a constant, and a horizontal line has an equation of the form
Similarly, the inequality may represent the inequality in two variables
Its graph is then a region in the plane.
Graph in the plane.
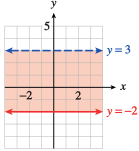
Graph in the plane.
Systems of Inequalities
Some applications are best described by a system of two or more inequalities. The solutions to a system of inequalities include all points that are solutions to each inequality in the system. The graph of the system is the intersection of the shaded regions for each inequality in the system. For example, the figure at right shows the solutions of the system
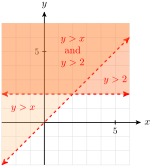
Use the following steps to graph the solutions of the system
- Graph the boundary line .
- Lightly shade the solutions of the inequality .
- Graph the boundary line .
- Lightly shade the solutions of .
- Shade the intersection of the two solutions sets.
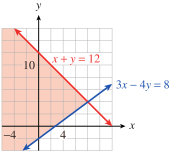
Use the following steps to graph the solutions of the system
- Graph the boundary line .
- Lightly shade the solutions of the inequality .
- Graph the boundary line .
- Lightly shade the solutions of .
- Shade the intersection of the two solutions sets.
Why do we shade the intersection of the solution sets when solving a system of inequalities?
_____
Why do we shade the intersection of the solution sets when solving a system of inequalities?
To describe the solutions of a system of inequalities, it is useful to locate the vertices, or corner points, of the boundary.
The first quadrant includes all the solutions of
_____
The first quadrant includes all the solutions of
- Graph the system of inequalities
- Find the coordinates of the vertices of the solution set.
_____ Separate different ordered pairs with a comma.
- See graph below.
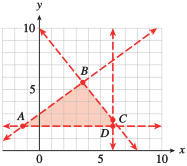
- Graph the system of inequalities
- Find the coordinates of the vertices of the solution set.
To find the vertices of the solution set for a system of inequalities, we
_____
solve a system of equations.
To find the vertices of the solution set for a system of inequalities, we
- use a test point.
- use the vertex formula.
- solve a system of equations.
- find the -intercepts.
Section Summary
Vocabulary
Look up the definitions of new terms in the Glossary.
- Half-plane
- Test point
- Vertices
CONCEPTS
- The solutions of a linear inequality in two variables consist of a half-plane on one side of the line. The line itself is not included if the inequality is strict.
- Once we have graphed the boundary line, we can decide which half-plane to shade by using a test point.
- The solutions to a system of inequalities include all points that are solutions to each inequality in the system. The graph of the system is the intersection of the shaded regions for each inequality in the system.
- To describe the solutions of a system of inequalities, it is useful to locate the vertices, or corner points, of the boundary.
STUDY QUESTIONS
- The solutions of a linear inequality in two variables form what sort of set?
- How can you find the boundary of the solution set?
- If your test point is not a solution of the inequality, which side of the line should you shade?
- How can you find the vertices of the solution set of a system of inequalities?
SKILLS
Practice each skill in the Homework problems listed.
- Graph the solutions of a linear inequality in two variables: #1–16
- Graph the solutions of a system of inequalities: #17–36
- Solve problems using inequalities: #37–42
Homework 8.4
For Problems 1–16, graph the inequality.
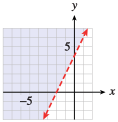
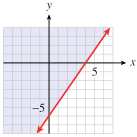
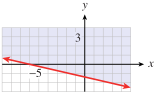
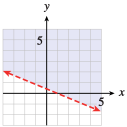
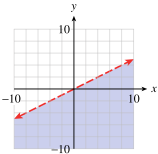
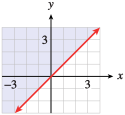
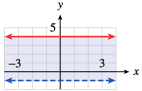
For Problems 17–6, graph the system of inequalities.
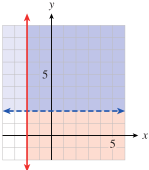
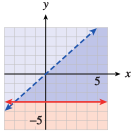
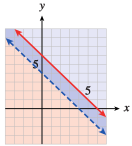
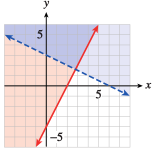
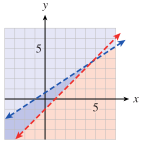
For Problems 27–36, graph the system of inequalities and find the coordinates of the vertices.
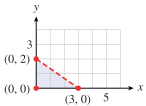
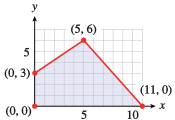
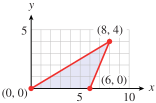
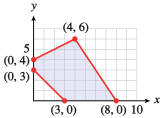
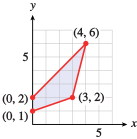
For Problems 37–42, graph the set of solutions to the problem. Two of the inequalities in each system are and .
The math club is selling tickets for a show by a mathemagician. Student tickets will cost $ and faculty tickets will cost $. The ticket receipts must be at least $ to cover the fee for the performer. Write a system of three inequalities for the number of student tickets and the number of faculty tickets that must be sold, and graph the solutions.
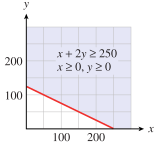
The math department is having a book sale of old textbooks to raise at least $ for scholarships. Paperback textbooks will cost $ and the hardcover textbooks will cost $. Write a system of three inequalities for the number of paperback and hardback textbooks that must be sold, and graph the solutions.
Vassilis plans to invest at most $ in two banks. One bank pays annual interest and the other pays annual interest. Vassilis wants at least $ total annual interest from his two investments. Write a system of four inequalities for the amount Vassilis can invest in the two accounts, and graph the system.
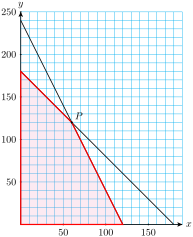
Jeannette has acres of farmland for growing wheat or soy. She can get a profit of $ per acre for wheat and $ per acre for soy. She wants to have a profit of at least $ from her crops. Write a system of four inequalities for the number of acres she can use for each crop, and graph the solutions.
Gary's pancake recipe includes corn meal and whole wheat flour. Corn meal has grams of linoleic acid and milligrams of niacin per cup. Whole wheat flour has gram of linoleic acid and milligrams of niacin per cup. These two ingredients should not exceed cups total. The mixture should provide at least grams of linoleic acid and at least milligrams of niacin. Write a system of five inequalities for the amount of corn meal and the amount of whole wheat flour Gary can use, then graph the solutions.
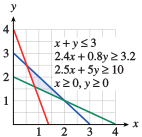
Cho and his brother go into business making comic book costumes. They need hour of cutting and hours of sewing to make a Batman costume. They need hours of cutting and hour of sewing to make a Wonder Woman costume. They have available at most hours per day for cutting and at most hours per day for sewing. They must make at least one costume each day to stay in business. Write a system of five inequalities for the number of each type of costume Cho can make, then graph the solutions.
Modeling, Functions, and Graphs by Katherine Yoshiwara (yoshiwarabooks.org), GNU Free Documentation License 1.2 or later. Adapted for the XYZ HTML edition with the authors' permission (recorded 2026-07-04). License: GFDL-1.2-or-later.