
5.5 Chapter Summary and Review
Key Concepts
- We can make a table of values for the inverse function, , by interchanging the columns of a table for .
- If a function is defined by a formula in the form , we can find a formula for its inverse function by solving the equation for to get .
- The inverse function undoes the effect of the function , that is, if we apply the inverse function to the output of , we return to the original input value.
- If is the inverse function for , then is also the inverse function for
- The graphs of and its inverse function are symmetric about the line .
- Horizontal line test: If no horizontal line intersects the graph of a function more than once, then the inverse is also a function.
- A function that passes the horizontal line test is called one-to-one.
- The inverse of a function is also a function if and only if is one-to-one.
- We define the logarithmic function, , which takes the log base of its input values. The log function is the inverse of the exponential function .
- A logarithmic equation is one where the variable appears inside of a logarithm. We can solve logarithmic equations by converting to exponential form.
- The natural base is an irrational number called , where
- The natural exponential function is the function . The natural log function is the function .
- We use the natural logarithm to solve exponential equations with base .
- Continuous compounding: The amount accumulated in an account after years at interest rate compounded continuously is given by where is the principal invested.
- A log scale is useful for plotting values that vary greatly in magnitude. We plot the log of the variable, instead of the variable itself.
- A log scale is a multiplicative scale: Each increment of equal length on the scale indicates that the value is multiplied by an equal amount.
- The pH value of a substance is defined by the formula where denotes the concentration of hydrogen ions in the substance.
- The loudness of a sound is measured in decibels, , by where is the intensity of its sound waves (in watts per square meter).
- The Richter magnitude, , of an earthquake is given by where is the amplitude of its seismographic trace and is the amplitude of the smallest detectable earthquake.
- A difference of units on a logarithmic scale corresponds to a factor of units in the value of the variable.
Chapter 5 Review Problems
For Problems 1–4, make a table of values for the inverse function.
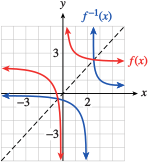
For Problems 5–6, use the graph to find the function values.
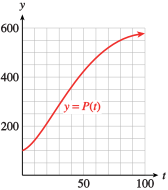
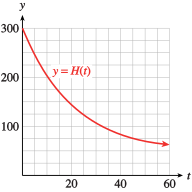
For Problems 7–12,
- Find a formula for the inverse of each function.
- Graph the function and its inverse on the same set of axes, along with the graph of .
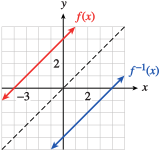
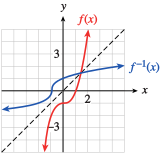
If , find .
If , find .
The table shows the revenue, , from sales of the Miracle Mop as a function of the number of dollars spent on advertising, . Let be the name of the function defined by the table, so .
| (thousands of dollars) | |||||
|---|---|---|---|---|---|
| (thousands of dollars) |
- Evaluate . Explain its meaning in this context.
- Write two equations to answer the following question, one using and one using : How much should we spend on advertising to generate revenue of ?
- : in advertising results in in revenue.
- or
The table shows the systolic blood pressure, , of a patient as a function of the dosage, , of medication he receives. Let be the name of the function defined by the table, so .
| (mg) | |||||
|---|---|---|---|---|---|
| (mm Hg) |
- Evaluate . Explain its meaning in this context.
- Write two equations to answer the following question, one using and one using : What dosage results in systolic blood pressure of ?
For Problems 17–24, write the equation in exponential form.
For Problems 25–28, simplify.
For Problems 29–36, solve.
For Problems 37–40, solve.
For Problems 41–46, solve.
For Problems 47–50, simplify.
In 1970, the population of New York City was . In 1980, the population had fallen to .
- Write an exponential function using base for the population of New York over that decade.
- By what percent did the population decline annually?
In 1990, the population of New York City was . In 2000, the population was .
- Write an exponential function using base for the population of New York over that decade.
- By what percent did the population increase annually?
You deposit $ in a savings account paying interest compounded continuously.
- Find the amount in the account after years.
- How long will it take for the original principal to double?
- Find a formula for the time required for the amount to reach .
- $
- years
The voltage, , across a capacitor in a certain circuit is given by the function
where is the time in seconds.
- Make a table of values and graph for to .
- Describe the graph. What happens to the voltage in the long run?
- How much time must elapse (to the nearest hundredth of a second) for the voltage to reach volts?
Solve for :
Solve for :
Solve for :
Solve for :
Express in the form .
Express in the form .
Express in the form .
Express in the form .
Plot the values on a log scale.

Plot the values on a log scale.
The graph describes a network of streams near Santa Fe, New Mexico. It shows the number of streams of a given order, which is a measure of their size. Use the graph to estimate the number of streams of orders , , , and . (Source: Leopold, Wolman, and Miller)
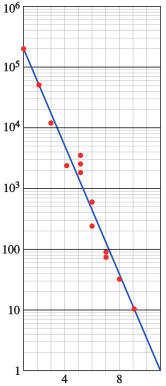
Order : ; Order : ; Order : ; Order :
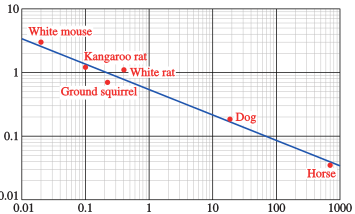
Large animals use oxygen more efficiently when running than small animals do. The graph shows the amount of oxygen various animals use, per gram of their body weight, to run kilometer. Estimate the body mass and oxygen use for a kangaroo rat, a dog, and a horse. (Source: Schmidt-Neilsen, 1972)
The pH of an unknown substance is . What is its hydrogen ion concentration?
The noise of a leaf blower was measured at decibels. What was the intensity of the sound waves?
A refrigerator produces decibels of noise, and a vacuum cleaner produces decibels. How much more intense are the sound waves from a vacuum cleaner than those from a refrigerator?
In 2004, a magnitude earthquake struck Sumatra in Indonesia. How much more powerful was this quake than the 1906 San Francisco earthquake of magnitude ?
Modeling, Functions, and Graphs by Katherine Yoshiwara (yoshiwarabooks.org), GNU Free Documentation License 1.2 or later. Adapted for the XYZ HTML edition with the authors' permission (recorded 2026-07-04). License: GFDL-1.2-or-later.