
5.4 Logarithmic Scales
Introduction
Because logarithmic functions grow very slowly, they are useful for modeling phenomena that take on a very wide range of values. For example, biologists study how metabolic functions such as heart rate are related to an animal’s weight, or mass. The table shows the mass in kilograms of several mammals.
| Animal | Shrew | Cat | Wolf | Horse | Elephant | Whale |
|---|---|---|---|---|---|---|
| Mass, kg |
Imagine trying to scale the -axis to show all of these values. If we set tick marks at intervals of kg, as shown below, we can plot the mass of the whale, and maybe the elephant, but the dots for the smaller animals will be indistinguishable.

On the other hand, we can plot the mass of the cat if we set tick marks at intervals of kg, but the axis will have to be extremely long to include even the wolf. We cannot show the masses of all these animals on the same scale

To get around this problem, we'll compute the the log of each mass, and use the logs on a new scale. The table below shows the base 10 log of each animal's mass, rounded to decimal places.
| Animal | Shrew | Cat | Wolf | Horse | Elephant | Whale |
|---|---|---|---|---|---|---|
| Mass, kg | ||||||
| Log (mass) |
The logs of the masses range from to . We can easily plot these values on a single scale, as shown below.

We'd need to keep in mind that we are plotting the logs of the animals' masses, and not the actual masses. However, remember that a logarithm is really an exponent! For example, the mass of the horse is 300 kg, and
So instead of plotting the logs from the table, we will plot powers of 10 that give the actual masses of the animals, like this:

Compare this new scale to the previous one. It looks almost the same, except that the number line is labeled with powers of 10. Even though we computed the log of each mass, we still plotted the actual mass of each animal, in its form as a power of 10. It is the scale on the number line that has changed.
A scale labeled with powers of 10 is called a logarithmic scale, or log scale. The powers of 10 on a log scale are evenly spaced, so that the actual values at the tick marks look like this.

We can see right away that the increments between tick marks on a log scale are not equal, as they are on a usual linear scale. The increments get larger as we move from left to right on the scale. However, when we are plotting powers of 10 we use the exponents to place the data points on the scale.
For example, you can check that the mass of the horse, at kg, is plotted about half-way between and on the log scale, because 2.48 is about half-way between 2 and 3. Similarly, the mass of the cat, at kg, is plotted between and on the log scale.
A value of 5682.7 would be plotted between which two integers on a log scale?
_____
3 and 4
A value of 5682.7 would be plotted between which two integers on a log scale?
- 5682 and 5683
- 5000 and 6000
- 5 and 6
- 3 and 4

Complete the table by estimating the logarithm of each point plotted on the log scale above. Then use a calculator to give a decimal value for each point.
| _____ | _____ | _____ | _____ | |
|---|---|---|---|---|
| _____ | _____ | _____ | _____ |
Complete the table by estimating the logarithm of each point plotted on the log scale below. Then use a calculator to give a decimal value for each point.
What is a log scale used for?
_____
To plot data that covers a wide range of values.
What is a log scale used for?
- To find the logarithm of a number.
- To plot data that covers a wide range of values.
- To highlight the curvature in the graph of an exponential function.
- To convert logarithms to base 10.
To plot data that covers a wide range of values.
Using Log Scales
By now, you have noticed that the values represented by points on a log scale increase rapidly as we move to the right along the scale. Also notice that , so the "middle" of a log scale represents (not zero, as on a linear scale).
Points to the left of represent fractions between and , because powers of with negative exponents are numbers less than . Their values decrease toward as we move to the left, but they never become negative.
We cannot plot negative numbers or zero on a log scale, because the log of a negative number or zero is undefined.
Plot the following dollar values on a log scale.
| Postage stamp | |
|---|---|
| Notebook computer | |
| One year at Harvard | |
| 2016 Lamborghini | |
| Kobe Bryant salary | |
| Bill Gates financial worth | |
| U.S. National debt |
A graph is below.

Plot the following dollar values on a log scale.
| Postage stamp | |
|---|---|
| Notebook computer | |
| One year at Harvard | |
| 2016 Lamborghini | |
| Kobe Bryant salary | |
| Bill Gates financial worth | |
| U.S. National debt |
How does a log scale differ from a linear scale?
_____
How does a log scale differ from a linear scale?
Equal Increments on a Log Scale
Log scales allow us to plot a wide range of values, but there is a trade-off. Equal increments on a log scale do not correspond to equal differences in value, as they do on a linear scale. You can see this more clearly if we label the tick marks with their integer values, as well as powers of 10. The difference between and is , but the difference between and is .
If we include tick marks for intermediate values on the log scale, they look like this.

Once again, the difference between, say, and is not the same as the difference between and . The decimal values of the powers through , rounded to two places, are shown below.

As we move from left to right on this scale, we multiply the value at the previous tick mark by , or about . For example,
and so on. Moving up by equal increments on a log scale does not add equal amounts to the values plotted; it multiplies the values by equal factors.
Which statement is false?
_____
"Equal increments on a log scale correspond to equal differences in value" is a false statement.
Which statement is false?
- We use log scales to graph a variable that has a wide range of values.
- On a log scale, we actually plot exponents.
- Values less than one appear as negative numbers on a log scale.
- Equal increments on a log scale correspond to equal differences in value.
"Equal increments on a log scale correspond to equal differences in value" is a false statement.
What number is halfway between and on a log scale?
Answer: _____
What number is halfway between and on a log scale?
If we would like to label the log scale with integers, we get a very different-looking scale, one in which the tick marks are not evenly spaced.
On the log scale in Example, notice how the integer values are spaced: They get closer together as they approach the next power of . You will often see log scales labeled not with powers of , but with integer values, like this:

In fact, log-log graph paper scales both axes with logarithmic scales.
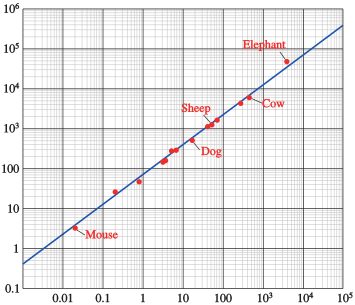
The opening page of Power Functions shows the "mouse-to-elephant" curve, a graph of the metabolic rate of mammals as a function of their mass. (The elephant does not appear on that graph, because its mass is too big.) The figure above shows the same function, graphed on log-log paper.
Use this graph to estimate the mass and metabolic rate for the following animals, labeled on the graph.
| Animal | Mouse | Dog | Sheep |
|---|---|---|---|
| Mass (kg) | _____ | _____ | _____ |
| Metabolic rate (kcal/day) | _____ | _____ | _____ |
| Animal | Cow | Elephant |
|---|---|---|
| Mass (kg) | _____ | _____ |
| Metabolic rate (kcal/day) | _____ | _____ |
Do not use commas. For example, use "10000" rather than "10,000".
| Animal | Mouse | Dog | Sheep | Cow | Elephant |
|---|---|---|---|---|---|
| Mass (kg) | |||||
| Metabolic rate (kcal/day) |
The opening page of Power Functions shows the "mouse-to-elephant" curve, a graph of the metabolic rate of mammals as a function of their mass. Here it is again.
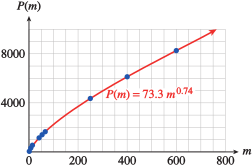
(The elephant does not appear on that graph, because its mass is too big.) The figure below shows the same function, graphed on log-log paper.
Use this graph to estimate the mass and metabolic rate for the following animals, labeled on the graph.
| Animal | Mouse | Dog | Sheep | Cow | Elephant |
|---|---|---|---|---|---|
| Mass (kg) | |||||
| Metabolic rate (kcal/day) |
| Animal | Mouse | Dog | Sheep | Cow | Elephant |
|---|---|---|---|---|---|
| Mass (kg) | |||||
| Metabolic rate (kcal/day) |
If , the difference between and on a log scale is 2 units. Use the properties of logarithms to explain why this is true.
_____
If , the difference between and on a log scale is 2 units. Use the properties of logarithms to explain why this is true.
Acidity and the pH Scale
You may have already encountered log scales in some everyday applications. A simple example is the pH scale, used by chemists to measure the acidity of a substance or chemical compound. This scale is based on the concentration of hydrogen ions in the substance, denoted by . The pH value is defined by the formula
Values for pH fall between and , with indicating a neutral solution. The lower the pH value, the more acidic the substance. Some common substances and their pH values are shown in the table.
| Substance | pH | |
|---|---|---|
| Battery acid | ||
| Lemon juice | ||
| Vinegar | ||
| Milk | ||
| Baking soda | ||
| Milk of magnesia | ||
| Lye |
The pH of the water in a tide pool is . What is the hydrogen ion concentration of the water?
Answer: _____
The pH of the water in a tide pool is . What is the hydrogen ion concentration of the water?
A decrease of on the pH scale corresponds to an increase in acidity by a factor of . Thus, lemon juice is times more acidic than vinegar, and battery acid is times more acidic than vinegar.
Decibels
The decibel scale, used to measure the loudness or intensity of a sound, is another example of a logarithmic scale. The loudness of a sound is measured in decibels, by
where is the intensity of its sound waves (in watts per square meter). The table below shows the intensity of some common sounds, measured in watts per square meter.
| Sound | Intensity (watts/m) | Decibels |
|---|---|---|
| Whisper | ||
| Background music | ||
| Loud conversation | ||
| Heavy traffic | ||
| Jet airplane | ||
| Thunder |
Consider the ratio of the intensity of thunder to that of a whisper:
Thunder is , or one billion times more intense than a whisper. It would be impossible to show such a wide range of values on a graph. When we use a log scale, however, there is a difference of only 90 decibels between a whisper and thunder.
The noise of city traffic registers at about decibels.
- What is the intensity of traffic noise, in watts per square meter?
Answer: _____ watts/m - How many times more intense is traffic noise than conversation?
Answer: _____ times
- watts/m
The noise of city traffic registers at about decibels.
- What is the intensity of traffic noise, in watts per square meter?
- How many times more intense is traffic noise than conversation?
- watts/m
The Richter Scale
One method for measuring the magnitude of an earthquake compares the amplitude of its seismographic trace with the amplitude of the smallest detectable earthquake. The log of their ratio is the Richter magnitude, . Thus,
In October 2005, a magnitude 7.6 earthquake struck Pakistan. How much more powerful was this earthquake than the 1989 San Francisco earthquake of magnitude 7.1?
Answer: _____
In October 2005, a magnitude 7.6 earthquake struck Pakistan. How much more powerful was this earthquake than the 1989 San Francisco earthquake of magnitude 7.1?
How much stronger is magnitude 4 earthquake than a magnitude 2 earthquake?
_____
100 times as strong.
How much stronger is magnitude 4 earthquake than a magnitude 2 earthquake?
- Twice as strong.
- Four times as strong.
- 16 times as strong.
- 100 times as strong.
Two points, labeled and , differ by units on a log scale. What is the ratio of their decimal values?
Answer: _____
Two points, labeled and , differ by units on a log scale. What is the ratio of their decimal values?
Explain what negative values on a log scale mean.
_____
Explain what negative values on a log scale mean.
Section Summary
Vocabulary
Look up the definitions of new terms in the Glossary.
- Log scale
- Log-log paper
CONCEPTS
- A log scale is useful for plotting values that vary greatly in magnitude. We plot the log of the variable instead of the variable itself.
- A log scale is a multiplicative scale: Each increment of equal length on the scale indicates that the value is multiplied by an equal amount.
- The pH value of a substance is defined by the formula where denotes the concentration of hydrogen ions in the substance.
- The loudness of a sound is measured in decibels, , by where is the intensity of its sound waves (in watts per square meter).
- The Richter magnitude, , of an earthquake is given by where is the amplitude of its seismographic trace and is the amplitude of the smallest detectable earthquake.
- A difference of units on a logarithmic scale corresponds to a factor of units in the value of the variable.
STUDY QUESTIONS
- What numbers are used to label the axis on a log scale?
- What does it mean to say that a log scale is a multiplicative scale?
- Delbert says that decibels is twice as loud as decibels. Is he correct? Why or why not?
- Which is farther on a log scale, the distance between and , or the distance between and ?
SKILLS
Practice each skill in the Homework problems listed.
- Plot values on a log scale: #1–4, 9 and 10
- Read values from a log scale: #5–8, 11–14, 19 and 20
- Compare values on a log scale: #15–18
- Use log scales in applications: #21–40
Homework 5.4
- The log scale is labeled with powers of . Finish labeling the tick marks in the figure with their corresponding decimal values.

- The log scale is labeled with integer values. Label the tick marks in the figure with the corresponding powers of .



- The log scale is labeled with powers of . Finish labeling the tick marks in the figure with their corresponding decimal values.

- The log scale is labeled with decimal values. Label the tick marks in the figure with the corresponding powers of .

Plot the values on a log scale.

Plot the values on a log scale.
Estimate the decimal value of each point on the log scale.

, , ,
Estimate the decimal value of each point on the log scale.

The log scale shows various temperatures in Kelvins. Estimate the temperatures of the events indicated.
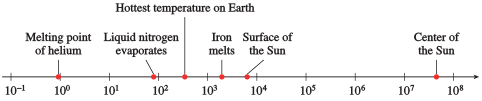
, , , , ,
The log scale shows the size of various objects, in meters. Estimate the sizes of the objects indicated.

Plot the values of in the section "Acidity and the pH Scale" on a log scale.

Plot the values of sound intensity in the section "Decibels" on a log scale.
The magnitude of a star is a measure of its brightness. It is given by the formula
where is the luminosity of the star, measured in solar units. Calculate the magnitude of the stars whose luminosities are given in the figure.

Proxima Centauri: ; Barnard: ; Sirius: ; Vega: ; Arcturus: ; Antares: ; Betelgeuse:
Estimate the wavelength, in meters, of the types of electromagnetic radiation shown in the figure.

The risk magnitude of an event is defined by , where is the probability of the event occurring. Calculate the probability of each event.
- The sun will rise tomorrow, .
- The next child born in Arizona will be a boy, .
- A major hurricane will strike North Carolina this year, .
- A 100-meter asteroid will collide with Earth this year, .
- You will be involved in an automobile accident during a 10-mile trip, .
- A comet will collide with Earth this year, .
- You will die in an automobile accident on a 1000-mile trip,
- You will die in a plane crash on a 1000-mile trip, .
Have you ever wondered why time seems to pass more quickly as we grow older? One theory suggests that the human mind judges the length of a long period of time by comparing it with its current age. For example, a year is of a -year-old's lifetime, but only of a -year-old's, so a year feels longer to a -year-old. Thus, psychological time follows a log scale, like the one shown in the figure.

- Label the tick marks with their base logarithms, rounded to decimal places. What do you notice about the values?
- By computing their logs, locate and on the scale
- Four years of college seems like a long time to an -year-old. What length of time feels the same to a -year-old?
- How long will the rest of your life feel? Let be your current age, and let be the age to which you think you will live. Compute the difference of their logs. Now move backward on the log scale an equal distance from your current age. What is the age at that spot? Call that age . The rest of your life will feel the same as your life from age until now.
- Compute using a proportion instead of logs.
- What number is halfway between and on a log scale?
- What number is halfway between and on a log scale?
- What number is halfway between and on a log scale?
- What number is halfway between and on a log scale?
The distances to two stars are separated by units on a log scale. What is the ratio of their distances?
The populations of two cities are separated by units on a log scale. What is the ratio of their populations?
The probability of discovering an oil field increases with its diameter, defined to be the square root of its area. Use the graph to estimate the diameter of the oil fields at the labeled points, and their probability of discovery. (Source: Deffeyes, 2001)
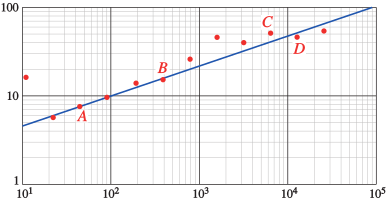
A: , ; B: , ; C: , ; D: ,
The order of a stream is a measure of its size. Use the graph to estimate the drainage area, in square miles, for streams of orders through . (Source: Leopold, Wolman, and Miller)
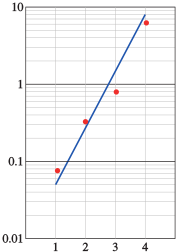
In Problems 21–40, use the appropriate formulas for logarithmic models.
The hydrogen ion concentration of vinegar is about . Calculate the pH of vinegar.
The hydrogen ion concentration of spinach is about . Calculate the pH of spinach.
The pH of lime juice is . Calculate its hydrogen ion concentration.
The pH of ammonia is . Calculate its hydrogen ion concentration.
A lawn mower generates a noise of intensity watts per square meter. Find the decibel level of the sound of a lawn mower.
A jet airplane generates watts per square meter at a distance of feet. Find the decibel level for a jet airplane.
The loudest sound emitted by any living source is made by the blue whale. Its whistles have been measured at decibels and are detectable miles away. Find the intensity of the blue whale's whistle in watts per square meter.
watts per square meter
The loudest sound created in a laboratory registered at decibels. The energy from such a sound is sufficient to bore holes in solid material. Find the intensity of a -decibel sound.
At a concert by The Who in 1976, the sound level meters from the stage registered decibels. How many times more intense was this than a -decibel sound (the threshold of pain for the human ear)?
The loudest scientifically measured shouting by a human being registered decibels. How many times more intense was this than normal conversation at decibels?
The pH of normal rain is . Some areas of Ontario have experienced acid rain with a pH of . How many times more acidic is acid rain than normal rain?
The pH of normal hair is about , the average pH of shampoo is , and for conditioner. Compare the acidity of normal hair, shampoo, and conditioner.
How much more acidic is milk than baking soda? (Refer to the table in this section.)
Compare the acidity of lye and milk of magnesia. (Refer to the table in this section.)
In 1964, an earthquake in Alaska measured on the Richter scale. An earthquake measuring is considered small and causes little damage. How many times stronger was the Alaska quake than one measuring ?
On April 30, 1986, an earthquake in Mexico City measured on the Richter scale. On September 21, a second earthquake, this one measuring , hit Mexico City. How many times stronger was the September quake than the one in April?
A small earthquake measured on the Richter scale. What is the magnitude of an earthquake three times as strong?
Earthquakes measuring on the Richter scale often go unnoticed. What is the magnitude of a quake times as strong as a quake?
The sound of rainfall registers at decibels. What is the decibel level of a sound twice as loud?
The magnitude, , of a star is a function of its luminosity, , given by
If one star is times as luminous as another star, is the difference in their magnitudes?
Modeling, Functions, and Graphs by Katherine Yoshiwara (yoshiwarabooks.org), GNU Free Documentation License 1.2 or later. Adapted for the XYZ HTML edition with the authors' permission (recorded 2026-07-04). License: GFDL-1.2-or-later.