
5.1 Inverse Functions
Introduction
When you buy a house, your monthly mortgage payment is a function of the size of the loan. The table shows mortgage payments on -year loans of various sizes at % interest.
| Loan amount, | |||||
|---|---|---|---|---|---|
| Mortgage payment, |
For the function , the input value is the amount of the loan, and the output is the mortgage payment.
However, when you are shopping for a house, you may think of the mortgage payment as the input variable: If you can afford a certain monthly mortgage payment, how large a loan can you finance? Now the mortgage payment is the input value, and the loan amount is the output. By interchanging the inputs and outputs, we define a new function, , shown below.
| Mortgage payment, | |||||
|---|---|---|---|---|---|
| Loan amount, |
This new function gives the same information as the original function, , but from a different point of view. We call the function the inverse function for .
The elements of the range of are used as the input values for , and the output values of are the corresponding domain elements of . For example, from the tables you can verify that , and . In fact, this property defines the inverse function.
Suppose is the inverse function for , and suppose we know the following function values for f:
Find and .
_____
_____
;
Suppose is the inverse function for , and suppose we know the following function values for :
Find and .
;
If the point lies on the graph of , what point lies on the graph of its inverse function?
_____
If the point lies on the graph of , what point lies on the graph of its inverse function?
Finding a Formula for the Inverse Function
If a function is given by a table of values, we can interchange the columns (or rows) of the table to obtain the inverse function. Swapping the columns works because we are really interchanging the input and output variables. If a function is defined by an equation, we can find a formula for its inverse function in the same way: Interchange the roles of the variables in the equation so that the old output variable becomes the new input variable.
Which of these is the inverse of the function ?
_____
Which of these is the inverse of the function ?
Carol can burn 600 calories per hour bicycling and 400 calories per hour swimming. She would like to lose 5 pounds, which is equivalent to 16,000 calories.
- Write an equation relating the number of hours of cycling, , and the number of hours swimming, , that Carol must spend to lose 5 pounds. [Do not use commas: For example, enter "10000" rather than "10,000".
Answer: _____ - Write as a function of , .
_____
What does _____ tell you?
_____ - Find the inverse function, .
_____
What does _____ tell you?
_____
- ; ; If Carol cycles for 10 hrs, she must swim for 25 hrs.
- ; ; If Carol swims for hrs, she must cycle for hrs.
Carol can burn 600 calories per hour bicycling and 400 calories per hour swimming. She would like to lose 5 pounds, which is equivalent to 16,000 calories.
- Write an equation relating the number of hours of cycling, , and the number of hours swimming, , that Carol must spend to lose 5 pounds.
- Write as a function of , . What does tell you?
- Find the inverse function, . What does tell you?
- ; ; If Carol cycles for 10 hrs, she must swim for 25 hrs.
- ; ; If Carol swims for hrs, she must cycle for hrs.
Inverse Function Notation
If the inverse of a function is also a function, we denote the inverse by the symbol , read " inverse." This notation makes it clear that the two functions are related in a special way. For example, the function in Example has inverse function .
If , what is equal to?
_____
If , what is equal to?
- If , find .
_____ - Write two equations about the value of , one using and one using .
_____, and _____ - Show that is not equal to .
_____, but _____, which _____
- ,
- , but
- If , find .
- Write two equations about the value of , one using and one using .
- Show that is not equal to .
- ,
- , but
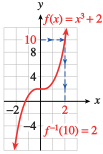
We can use a graph of a function to find values of the inverse function . The figure below shows the graph of .
You already know how to evaluate a function from its graph: We start with the horizontal axis. For instance, to evaluate , we find on the -axis, move vertically to the point on the graph with , in this case , and read the -coordinate of the point. We see that .
To evaluate the inverse function, we start with the vertical axis. For example, to find , we find on the vertical axis and move horizontally to the point on the graph with . In this case, the point is , so .
Use the graph of in Example.
- Find .
_____ - Does ? _____
- Select two equations, one using and one using , stating the Fahrenheit temperature when the Celsius temperature is .
- _____
- _____
- _____
- _____
- : On the graph of , when , .
- No
- ,
- Use the graph of in Example to find .
- Does ?
- Write two equations, one using and one using , stating the Fahrenheit temperature when the Celsius temperature is .
- : On the graph of , when , .
- No
- ,
If the function tells you how much money is in your account after years, what does the function tell you?
_____
If the function tells you how much money is in your account after years, what does the function tell you?
Graph of the Inverse Function
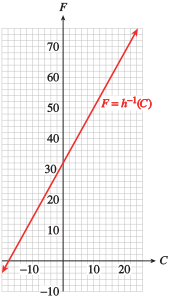
In Example, we used a graph of to read values of . But we can also plot the graph of itself. Because is the input variable for , we plot on the horizontal axis and on the vertical axis. To find some points on the graph of , we interchange the coordinates of points on the graph of . The graph of is shown at right.
The formula gives the period in seconds, , of a pendulum as a function of its length in feet, .
- Graph the function on the domain .
- Find a formula for the inverse function, . [Enter "pi" to get .]
_____
What is the meaning of the inverse function in this context?
_____ - Sketch a graph of the inverse function.
- A graph is below for both parts (a) and (c).
- gives the length of a pendulum as a function of its period.
- See graph for part(a) below.
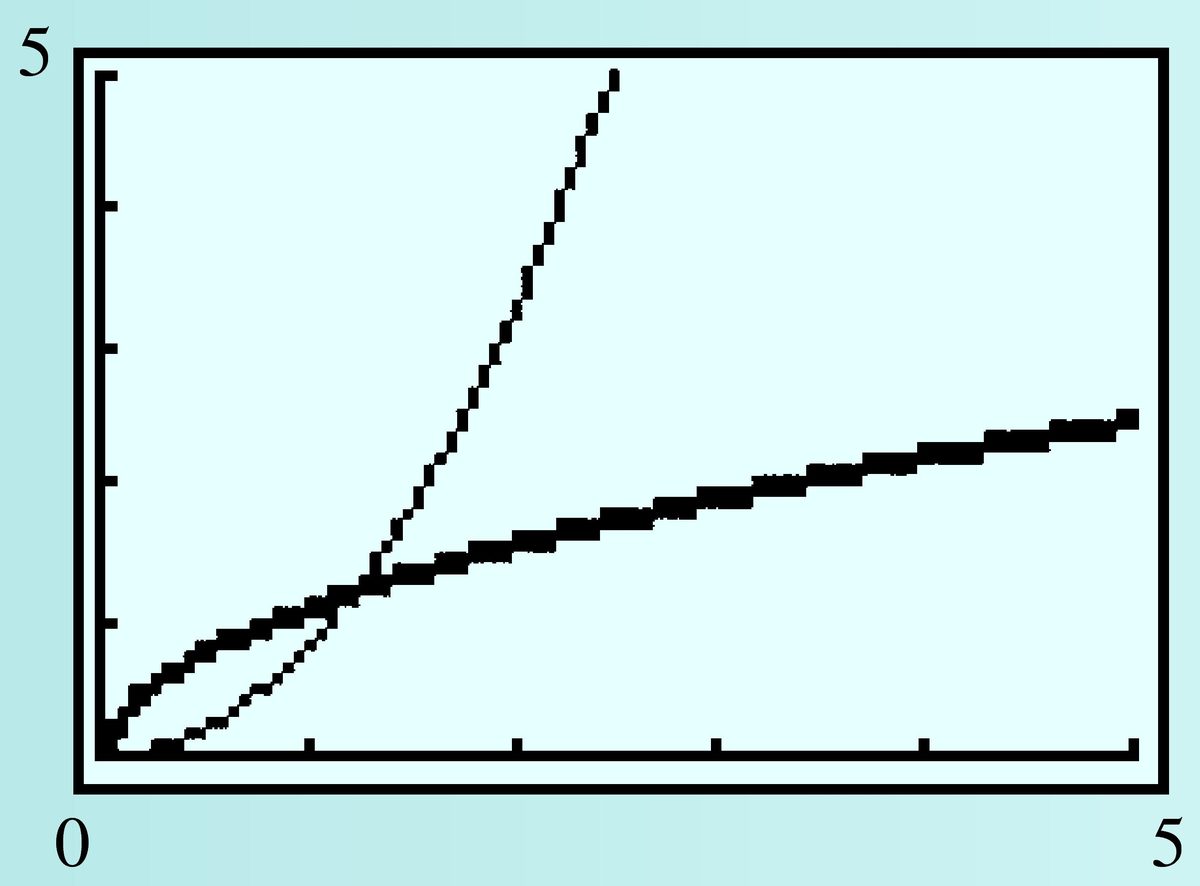
The formula gives the period in seconds, , of a pendulum as a function of its length in feet, .
- Graph the function on the domain .
- Find a formula for the inverse function, . What is the meaning of the inverse function in this context?
- Sketch a graph of the inverse function.
- gives the length of a pendulum as a function of its period.
- See graph for part(a).
When Is the Inverse a Function?
We can always find the inverse of a function simply by interchanging the input and output variables. In the preceding examples, interchanging the variables created a new function. However, the inverse of a function does not always turn out to be a function itself.
For example, to find the inverse of , we solve for to get . When we regard as the input and as the output, the relationship does not describe a function. The graphs of and its inverse are shown below. (Note that for the graph of the inverse, we plot on the horizontal axis and on the vertical axis.) Because the graph of the inverse does not pass the vertical line test, it is not a function.
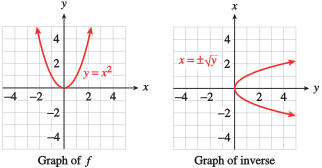
For many applications, it is important to know whether or not the inverse of is a function. This can be determined from the graph of . When we interchange the roles of the input and output variables, horizontal lines of the form become vertical lines.
Thus, if the graph of the inverse is going to pass the vertical line test, the graph of the original function must pass the horizontal line test, namely, that no horizontal line should intersect the graph in more than one point.
Notice that the graph of does not pass the horizontal line test, so we would not expect its inverse to be a function.
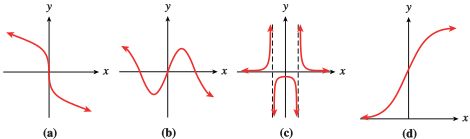
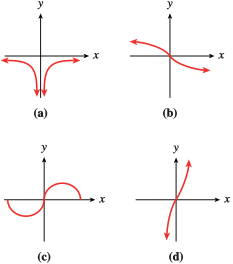
Which of the functions whose graphs are shown above have inverses that are also functions?
- _____
- _____
- _____
- _____
(a) and (d)
Which of the functions whose graphs are shown below have inverses that are also functions?
(a) and (d)
A function that passes the horizontal line test is called one-to-one, because each input has only one output and each output has only one input. A one-to-one function passes the horizontal line test as well as the vertical line test. With this terminology, we can state the following theorem.
What does the term one-to-one mean? Give an example.
_____
What does the term one-to-one mean? Give an example.
Mathematical Properties of the Inverse Function
The inverse function undoes the effect of the function . In Example, the function multiplies the input by and then adds to the result. The inverse function undoes those operations in reverse order: It subtracts from the input and then divides the result by .
If we apply the function to a given input value and then apply the function to the output from , the end result will be the original input value. For example, if we choose as an input value, we find that
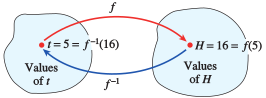
We return to the original input value, , as illustrated above.
An inverse function
_____
interchanges the input and output.
An inverse function
- makes the output negative.
- makes the input negative.
- interchanges the input and output.
- takes the reciprocal of the output.
Example illustrates the fact that if is the inverse function for , then is also the inverse function for .
- Find a formula for the inverse of the function Use as in input variable for .
_____ - Show that undoes the effect of on .
_____ and _____ - Show that undoes the effect of on .
_____ and _____
- , and
- and
- Find a formula for the inverse of the function .
- Show that undoes the effect of on .
- Show that undoes the effect of on .
- , and
- and
Symmetry
So far we have been careful to keep track of the input and output variables when we work with inverse functions. This is important when we are dealing with applications; the names of the variables are usually chosen because they have a meaning in the context of the application, and it would be confusing to change them.
However, we can also study inverse functions purely as mathematical objects. There is a relationship between the graph of a function and the graph of its inverse that is easier to see if we plot them both on the same set of axes.
A graph does not change if we change the names of the variables, so we can let represent the input for both functions, and let represent the output. Consider the function from Example, and its inverse function, . The formulas for these functions are
But their graphs are the same if we write them as
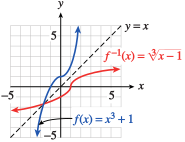
The graphs are shown below.
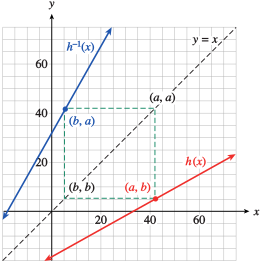
Now, for every point on the graph of , the point is on the graph of the inverse function. Observe that the points and are always located symmetrically across the line . The graphs are symmetric about the line , which means that if we were to place a mirror along the line , each graph would be the reflection of the other.
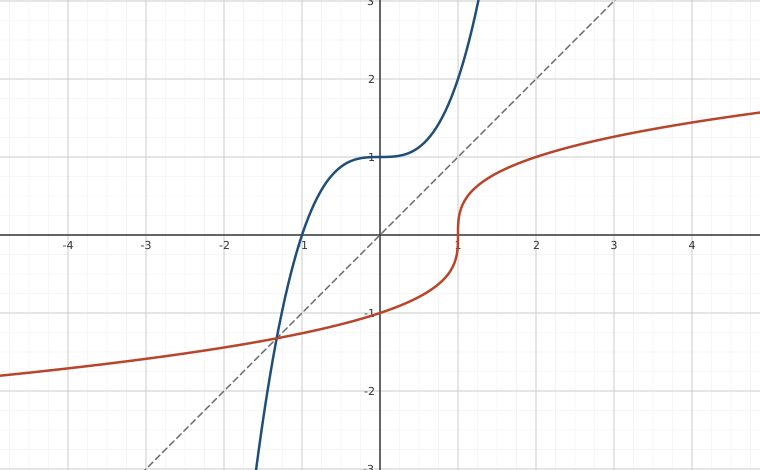
The graphs of and are symmetric about
_____
the line .
The graphs of and are symmetric about
- the -axis
- the -axis
- the asymptote.
- the line .
Graph the function and its inverse on the same set of axes, along with the line .
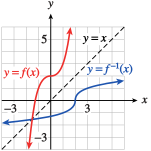
Graph the function and its inverse on the same set of axes, along with the line .
Explain the difference between the meaning of the notation if is a function or if is a variable.
_____
Explain the difference between the meaning of the notation if is a function or if is a variable.
Domain and Range
When we interchange the input and output variables to obtain the inverse function, we interchange the domain and range of the function. For the functions graphed in Example, you can see that
This relationship between the domain and range of a function and its inverse holds in general.
- Graph the function and its inverse function, (which you found above in Practice 7, on the same set of axes, along with the line .
- State the domain and range of , and of .
The domain of includes all real numbers except _____, and the range of includes all real number except _____
The domain of includes all real numbers except _____, and the range of includes all real number except _____
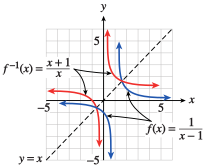
- A graph is below.
- Domain of : all real numbers except , Range of : all real numbers except , Domain of : all real numbers except , Range of : all real numbers except
Another graph of and
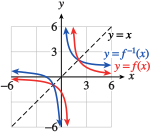
- Graph the function and its inverse function, (which you found above in Practice 7, on the same set of axes, along with the line .
- State the domain and range of , and of .
- Domain of : all real numbers except , Range of : all real numbers except , Domain of : all real numbers except , Range of : all real numbers except
Section Summary
Vocabulary
Look up the definitions of new terms in the Glossary.
- Inverse function
- Horizontal line test
- One-to-one
CONCEPTS
- The inverse of a function describes the same relationship between two variables but interchanges the roles of the input and output.
- We can make a table of values for the inverse function, , by interchanging the columns of a table for .
- If a function is defined by a formula in the form , we can find a formula for its inverse function by solving the equation for to get .
- The inverse function undoes the effect of the function , that is, if we apply the inverse function to the output of , we return to the original input value.
- If is the inverse function for , then is also the inverse function for .
- The graphs of and its inverse function are symmetric about the line .
- Horizontal line test: If no horizontal line intersects the graph of a function more than once, then the inverse is also a function.
- A function that passes the horizontal line test is called one-to-one.
- The inverse of a function is also a function if and only if is one-to-one.
STUDY QUESTIONS
- Explain how the terms inverse function, one-to-one, and horizontal line test are related.
- If you know that , what can you say about the values of ?
- Explain how to use a graph of the function to evaluate .
- Evaluate .
- Delbert says that if , then . Is he correct? Why or why not?
SKILLS
Practice each skill in the Homework problems listed.
- Given certain function values, find values of the inverse function: #1–4
- Interpret values of the inverse function: #5–12
- Find a formula for the inverse function: #9–22, 27–34
- Graph the inverse function: #15 and 16, 23–34
- Find the domain and range of the inverse function: #33 and 34
- Use the horizontal line test to identify one-to-one functions: #35–42
Homework 5.1
Let , , , and .
- Make a table of values for and another table for its inverse function.
- Find
- Find
Let , , , and .
- Make a table of values for and another table for its inverse function.
- Find
- Find
- Make a table of values for and another table for its inverse function.
- Find
- Find
- Make a table of values for and another table for its inverse function.
- Find
- Find
For Problems 5-8, use the graph to evaluate each expression.
An insurance investigator measures the length, , of the skid marks at an accident scene, in feet. The graph shows the function , which gives the velocity, (mph), at which a car was traveling when it hit the brakes.
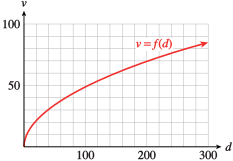
- Use the graph to estimate and explain its meaning in this context.
- Use the graph to estimate and explain its meaning in this context.
- . The car that left the -foot skid marks was traveling at mph.
- . The car traveling at mph left -foot skid marks
The weight, , of a missile launched from a catapult is a function of the distance, , to the target. The graph shows the function , where is in meters and is in kilograms.
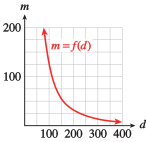
- Use the graph to estimate and explain its meaning in this context.
- Use the graph to estimate and explain its meaning in this context.
After eating, the weight of a vampire bat drops steadily until its next meal. The graph shows the function , which gives the weight, , of the bat in grams hours since its last meal.
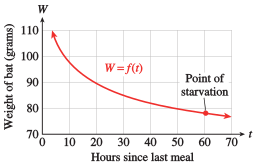
- Estimate the coordinates of the point of starvation. Include units in your answer.
- Use the graph to estimate and explain what it tells us about vampire bats.
- , so that the vampire bat's weight has dropped to grams about hours after its last meal.
The amount of money, , in an interest-bearing savings account is a function of the number of years, , it remains in the account. The graph shows , where is in thousands of dollars.
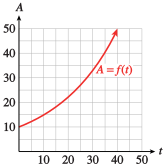
- Use the graph to estimate and explain what it tells us about the account.
- Use the graph to estimate and explain what it tells us about the account.
The function gives the interest, , that a dollar earns in years in terms of the interest rate, .
- Evaluate and explain what it tells us about the interest.
- Find the interest rate needed to earn by substituting in the formula and solving for .
- Find a formula for the inverse function.
- Write your answer to part (b) with inverse function notation.
- . At interest, earns interest in years.
The function gives the Celsius temperature in terms of the Fahrenheit temperature .
- Evaluate and explain what it tells us about the temperature.
- Find the Fahrenheit temperature of Celsius by substituting in the formula and solving for .
- Find a formula for the inverse function.
- Write your answer to part (b) with inverse function notation.
If you are flying in an airplane at an altitude of miles, on a clear day you can see a distance of miles to the horizon, where .
- Evaluate and explain what it tells us about the horizon.
- Find the altitude needed in order to see a distance of mile by substituting in the formula and solving for .
- Find a formula for the inverse function.
- Write your answer to part (b) with inverse function notation.
- . At an altitude of miles, you can see miles to the horizon.
- mile, or feet
A moving ship creates waves that impede its own speed. The function gives the ship's maximum speed in knots in terms of its length, , in feet.
- Evaluate and explain what it tells us about the ship's speed.
- Find the length needed for a maximum speed of knots by substituting in the formula and solving for .
- Find a formula for the inverse function.
- Write your answer to part (b) with inverse function notation.
- Use the graph of to find .
- Find a formula for and evaluate .
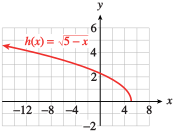
- ;
- Use the graph of to find .
- Find a formula for and evaluate .
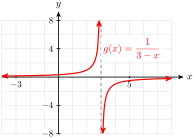
- Find for the function .
- Show that undoes the effect of on .
- Show that undoes the effect of on .
- Graph the function and its inverse on the same grid, along with the graph of .
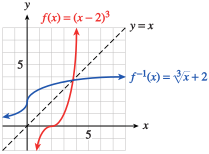
- Find for the function .
- Show that undoes the effect of on .
- Show that undoes the effect of on .
- Graph the function and its inverse on the same grid, along with the graph of .
If , find .
If , find .
If , find .
If , find .
If , find .
If , find .
For Problems 23–26,
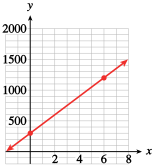
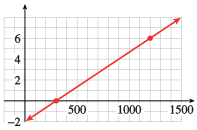
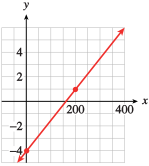
- Use the graph to make a table of values for the function .
- Make a table of values and a graph of the inverse function.
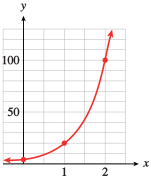
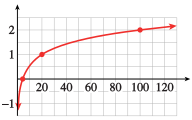
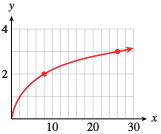
For Problems 27–32,
- Find a formula for the inverse of the function.
- Graph the function and its inverse on the same set of axes, along with the graph of .
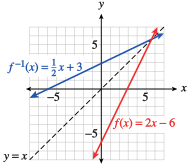
- Find the domain and range of the function .
- Find a formula for .
- State the domain and range of .
- Graph and on the same grid.
- Domain: ; Range:
- Domain: ; Range:
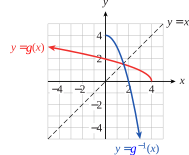
- Find the domain and range of the function .
- Find a formula for .
- State the domain and range of .
- Graph and on the same grid.
Which of the functions in Problems 35–42 have inverses that are also functions?
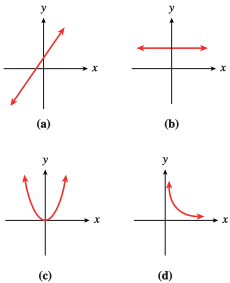
(a) and (d)
(a)
(a)
(a) and (b)
Find a formula for each function shown in (a)–(d). Then match each function with its inverse from I–IV.
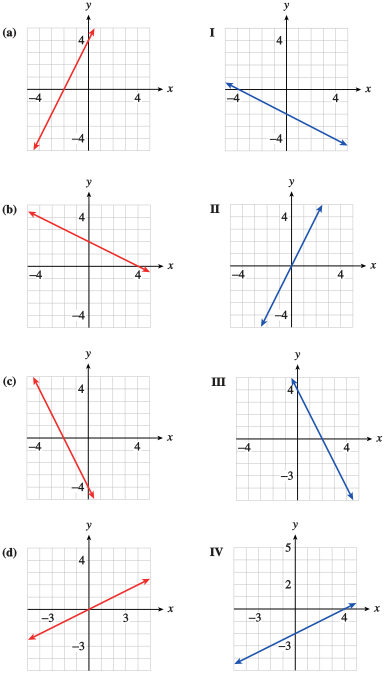
- ; IV
- ; III
- ; I
- ; II
Find a formula for each function shown in (a)–(d). Then match each function with its inverse from I–IV.
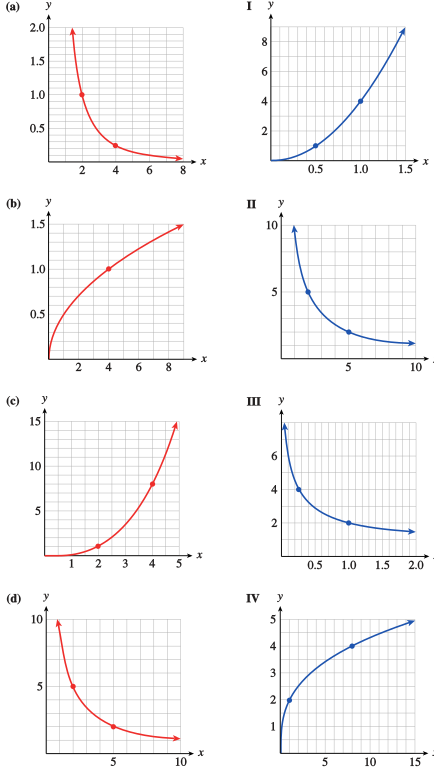
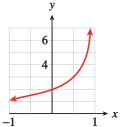
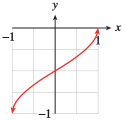
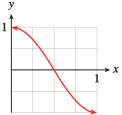
For Problems 45 and 46, use the graph of to match the other graphs with the appropriate function. (Hint: Look at the coordinates of some specific points.)
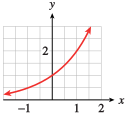
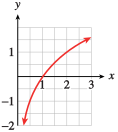
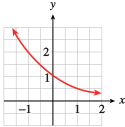
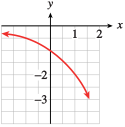
- III
- II
- I
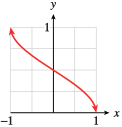
Modeling, Functions, and Graphs by Katherine Yoshiwara (yoshiwarabooks.org), GNU Free Documentation License 1.2 or later. Adapted for the XYZ HTML edition with the authors' permission (recorded 2026-07-04). License: GFDL-1.2-or-later.