
1.4 Slope and Rate of Change
Using Ratios for Comparison
Which is more expensive, a 64-ounce bottle of Velvolux dish soap that costs $3.52, or a 60-ounce bottle of Rainfresh dish soap that costs $3.36?
You are probably familiar with the notion of comparison shopping. To decide which dish soap is the better buy, we compute the unit price, or price per ounce, for each bottle. The unit price for Velvolux is
and the unit price for Rainfresh is
The Velvolux costs less per ounce, so it is the better buy. By computing the price of each brand for the same amount of soap, it is easy to compare them.
In many situations, a ratio, similar to a unit price, can provide a basis for comparison. Example uses a ratio to measure a rate of growth.
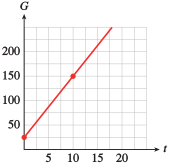
By computing the growth of each strain of wheat seedling over the same unit of time, a single day, we have a basis for comparison. In this case, the ratio measures the rate of growth of the wheat seedlings.
Delbert traveled miles on gallons of gas, and Francine traveled miles on gallons of gas. Compute the ratio for each car.
Delbert: _____
Francine: _____
Whose car gets the better gas mileage? _____
Delbert: mpg, Francine: mpg. Francine gets better mileage.
Delbert traveled miles on gallons of gas, and Francine traveled miles on gallons of gas. Compute the ratio for each car. Whose car gets the better gas mileage?
Delbert's gas mileage is mpg, and Francine's gas mileage is mpg. Francine gets better mileage.
The weight of gallons of gasoline is pounds, and the weight of gallons of water is pounds. Compute the ratio for each liquid.
gasoline: _____
water: _____
Which liquid weighs more per gallon_____
gasoline: pounds per gallon, water: pounds per gallon. Water weighs more per gallon.
The weight of gallons of gasoline is pounds, and the weight of gallons of water is pounds. Compute the ratio for each liquid. Which liquid weighs more per gallon?
Measuring Steepness
In Practice 1, the ratio measures the rate at which each car uses gasoline. By computing the mileage for each car for the same amount of gas, we have a basis for comparison. We can use this same idea, finding a common basis for comparison, to measure the steepness of an incline.
In Practice 1, the ratio measures the rate at which each car uses gasoline. By computing the mileage for each car for the same amount of gas, we have a basis for comparison. We can use this same idea, finding a common basis for comparison, to measure the steepness of an incline.
Imagine you are an ant carrying a heavy burden along one of the two paths shown below. Which path is more difficult? Most ants would agree that the steeper path is more difficult.
But what exactly is steepness? It is not merely the gain in altitude, because even a gentle incline will reach a great height eventually. Steepness measures how sharply the altitude increases. An ant finds the second path more difficult, or steeper, because it rises 5 feet while the first path rises only 2 feet over the same horizontal distance.
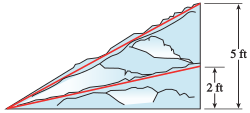
To compare the steepness of two inclined paths, we compute the ratio of change in altitude to change in horizontal distance for each path.
Which is steeper, a staircase that rises feet over a horizontal distance of feet, or the steps in the football stadium, which rise yards over a horizontal distance of yards?
Answer: _____
Staircase: , Steps: . The staircase is steeper.
Which is steeper, a staircase that rises feet over a horizontal distance of feet, or the steps in the football stadium, which rise yards over a horizontal distance of yards?
Staircase: ; steps: . The staircase is steeper.
Definition of Slope
To compare the steepness of the two trails in Example, it is not enough to know which trail has the greater gain in elevation overall. Instead, we compare their elevation gains over the same horizontal distance. Using the same horizontal distance provides a basis for comparison. The two trails are illustrated below as lines on a coordinate grid.
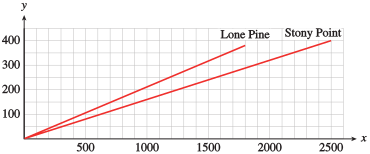
The ratio we computed in Example,
appears on the graphs as
For example, as we travel along the line representing Stony Point trail, we move from the point to the point . The -coordinate changes by and the -coordinate changes by , giving the ratio that we found in Example. We call this ratio the slope of the line.
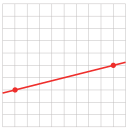
Compute the slope of the line through the indicated points on the graph above. On both axes, one square represents one unit.
_____
Compute the slope of the line through the indicated points on the graph at right. On both axes, one square represents one unit.
The slope is .
What is wrong with the following reasoning? The point lies on the graph of a line, so the slope of the line is .
_____
We need two points to compute the slope.
What is wrong with the following reasoning?
"The point lies on the graph of a line, so the slope of the line is ."
Choose the best answer.
- The slope is .
- is not an intercept.
- We need two points to compute the slope.
- The line is decreasing.
Notation for Slope
We use a shorthand notation for the ratio that defines slope,
The symbol (the Greek letter delta) is used in mathematics to denote change in. In particular, means change in -coordinate, and means change in -coordinate. We also use the letter to stand for slope. With these symbols, we can write the definition of slope as follows.
The Kukulcan Pyramid at Chichen Itza in Mexico was built around 800 A.D. It is meters high, with a temple built on its top platform, as shown at right.
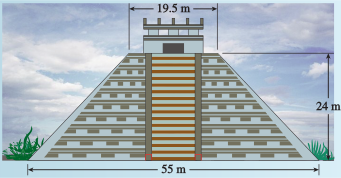
The square base is 55 meters on each side, and the top platform is 19.5 meters on each side. Calculate the slope of the sides of the pyramid. Which pyramid is steeper, Kukulcan or the Great Pyramid (whose slope, rounded to two decimals, is 1.28)?
Answer: _____
The horizontal change is half the difference between the sides of the base and of the top platform.
The horizontal change is half the difference between the sides of the base and of the top platform: , so the slope is , which is greater than 1.28. Kukulcan is steeper.
The Kukulcan Pyramid at Chichen Itza in Mexico was built around 800 A.D. It is meters high, with a temple built on its top platform, as shown below.
The square base is 55 meters on each side, and the top platform is 19.5 meters on each side. Calculate the slope of the sides of the pyramid. Which pyramid is steeper, Kukulcan or the Great Pyramid in the previous Example?
The horizontal change is half the difference between the sides of the base and of the top platform: , so the slope is , which is greater than 1.28. Kukulcan is steeper.
So far, we have only considered examples in which and are positive numbers, but they can also be negative.
Suppose represents your distance from home, in miles. Compare the meanings of the two statements and .
_____
Suppose represents your distance from home, in miles. Compare the meanings of the two statements and .
Lines Have Constant Slope
How do we know which two points to choose when we want to compute the slope of a line? It turns out that any two points on the line will do.
- Graph the line by finding the - and -intercepts
-intercept: _____
-intercept: _____
Note: Enter each intercept as an ordered pair. - Compute the slope of the line using the -intercept and -intercept.
_____ - Compute the slope of the line using the points and .
_____
- A graph of the line is shown below this exercise.
- The -intercept is and the -intercept is .
The slope is - The slope is
The graph for part (a):
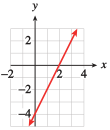
- Graph the line by finding the - and -intercepts.
- Compute the slope of the line using the -intercept and -intercept.
- Compute the slope of the line using the points and .
- The -intercept is and the -intercept is .
The slope is - The slope is
We can think of the slope as a scale factor that tells us how many units increases (or decreases) for each unit of increase in . Compare the lines shown below.
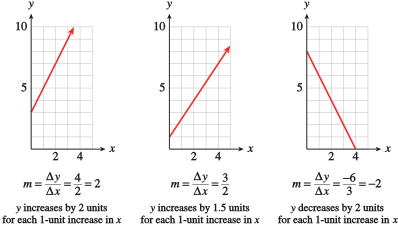
Observe that a line with positive slope increases from left to right, and one with negative slope decreases. What sort of line has slope ?
How can you tell from the equation of a line whether its graph is decreasing?
_____
The graph is decreasing when its slope is negative.
How can you tell from the equation of a line whether its graph is decreasing?
- Its slope is positive.
- Its -intercept is positive.
- Its slope is negative.
- Its -intercept is negative.
Meaning of Slope
In Example, we graphed the equation showing the cost of a bicycle rental in terms of the length of the rental. The graph is reproduced at right. We can choose any two points on the line to compute its slope. Using points and as shown, we find that
The slope of the line is .
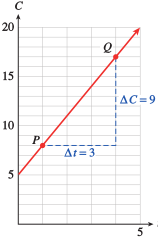
What does this value mean for the cost of renting a bicycle? The expression
stands for
If we increase the length of the rental by 3 hours, the cost of the rental increases by 9 dollars. The slope gives the rate of increase in the rental fee, 3 dollars per hour. In general, we can make the following statement.
Depending on the variables involved, this rate might be interpreted as a rate of growth or a rate of speed. A negative slope might represent a rate of decrease or a rate of consumption. The slope of a graph can give us valuable information about the variables.
The graph shows the altitude, (in feet), of a skier minutes after getting on a ski lift.
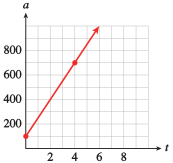
- Choose two points and compute the slope (including units). (Note: Use "ft" for feet and use "min" for minutes.)
_____ - What does the slope tell us about the problem?
_____
- The skier's altitude increases by feet per minute.
The graph shows the altitude, (in feet), of a skier minutes after getting on a ski lift.
- Choose two points and compute the slope (including units).
- What does the slope tell us about the problem?
- ft/min
- The skier's altitude increases by feet per minute.
How does slope measure rate of change?
_____
How does slope measure rate of change?
A Formula for Slope
We have defined the slope of a line to be the ratio as we move from one point to another on the line. So far, we have computed and by counting squares on the graph, but this method is not always practical. All we really need are the coordinates of two points on the graph.
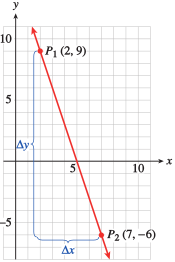
Now consider a specific example. The line through the two points and is shown at left. We can find by subtracting the -coordinates of the points:
In general, we have
and similarly
These formulas work even if some of the coordinates are negative; in our example
By counting squares down from to , we see that is indeed . The slope of the line is
We now have a formula for the slope of a line that works even if we do not have a graph.
- Find the slope of the line passing through the points and .
_____ - Sketch a graph of the line by hand.
- A graph is shown below.
A graph for part (b):
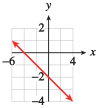
- Find the slope of the line passing through the points and .
- Sketch a graph of the line by hand.
Comment on the following calculation: The intercepts of a line are and , so the slope of the line is .
_____
It is false because and have opposite signs. (The slope of the line is .)
Which comment on the following calculation is true?
"The intercepts of a line are and , so the slope of the line is ."
- It is true because we used two points.
- It is false because and have opposite signs.
- It is true because the values are increasing.
- It is false because the slope is .
It will also be useful to write the slope formula with function notation. Recall that is another symbol for , and, in particular, that and . Thus, if , we have this formula.
The figure shows the graph of a function .
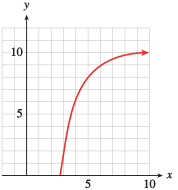
- Find and .
_____
_____ - Compute the slope of the line segment joining the points at and .
_____ - Write an expression for the slope of the line segment joining the points at and .
_____
Note: Be careful to use appropriate parentheses. Press the "Preview My Answers" button below to see if you are entering an appropriate expression.
The figure shows the graph of a function .
- Find and .
- Compute the slope of the line segment joining the points at and .
- Write an expression for the slope of the line segment joining the points at and .
Summarize what you learned about slope in this lesson.
_____
Summarize what you learned about slope in this lesson.
Section Summary
Vocabulary
Look up the definitions of new terms in the Glossary.
- Ratio
- Rate of change
- Slope
- Scale factor
CONCEPTS
- We can use ratios to compare quantities.
- The slope ratio, , measures the steepness of a line.
- Notation for slope: , .
- Formula for slope: ,
- Formula for slope: ,
- Lines have constant slope.
- Slope is a scale factor that tells us how many units increases for each unit increase in as we move along the line.
- The slope gives us the rate of change.
STUDY QUESTIONS
- Explain how to compare prices with unit pricing.
- Why is the numerator of the slope ratio and the denominator?
- Which line is steeper, one with or one with ?
- A classmate says that you must always use the intercepts to calculate the slope of a line. Do you agree? Explain.
- In an application, what does the slope of the graph tell you about the situation?
SKILLS
Practice each skill in the Homework problems listed.
- Use ratios for comparison: #1–4
- Compute slope from a graph: #5–16, 23–26
- Use slope to find or : #17–20, 27–30
- Use slope to compare steepness: #21 and 22
- Decide whether data points lie on a straight line: #41–46
- Interpret slope as a rate of change: #31–40
- Use function notation to discuss graphs and slope: #53–62
Homework 1.4
Compute ratios to answer the questions in Problems 1–4.
Carl runs meters in seconds. Anthony runs meters in seconds. Who has the faster average speed?
Anthony
On his -mile round trip to Las Vegas and back, Corey needed gallons of gasoline. He used gallons of gasoline on a -mile trip to Los Angeles. On which trip did he get better fuel economy?
Grimy Gulch Pass rises miles over a horizontal distance of miles. Bob's driveway rises feet over a horizontal distance of feet. Which is steeper?
Bob's driveway
Which is steeper, the truck ramp for Acme Movers, which rises feet over a horizontal distance of feet, or a toy truck ramp, which rises centimeters over a horizontal distance of centimeters?
In Problems 5–8, compute the slope of the line through the indicated points. On both axes, one square represents one unit.
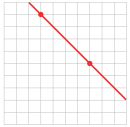
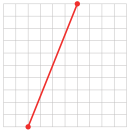
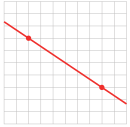
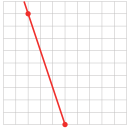
For Problems 9–14,
- Graph each line by the intercept method.
- Use the intercepts to compute the slope.
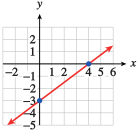
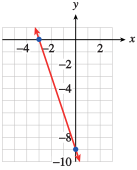
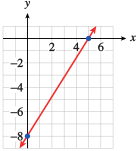
- Use the points and to compute the slope of the line. Illustrate and on the graph.
- Use the points and to compute the slope of the line. Illustrate and on the graph.
- Use the points and to compute the slope of the line. Illustrate and on the graph.
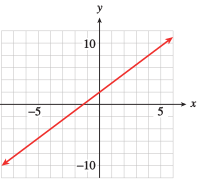
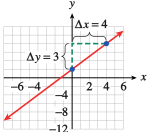
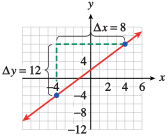
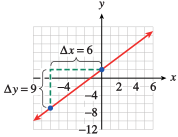
- Use the points and to compute the slope of the line. Illustrate and on the graph.
- Use the points and to compute the slope of the line. Illustrate and on the graph.
- Use the points and to compute the slope of the line. Illustrate and on the graph.
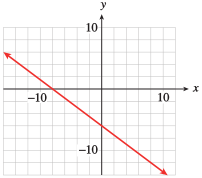
For Problems 17–20, use the formula
A line has slope .
- Find the vertical change associated with each horizontal change along the line.
- Find the horizontal change associated with each vertical change along the line.
A line has slope .
- Find the vertical change associated with each horizontal change along the line.
- Find the horizontal change associated with each vertical change along the line.
Residential staircases are usually built with a slope of , or . If the vertical distance between stories is feet, how much horizontal space does the staircase require?
ft ft ft in
A straight section of highway in the Midwest maintains a grade (slope) of , or , for miles. How much does your elevation change as you travel the road?
Choose the line with the correct slope. The scales are the same on both axes.
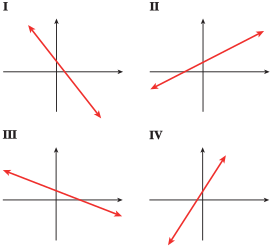
- IV
- III
- II
- I
Choose the line with the correct slope. The scales are the same on both axes.
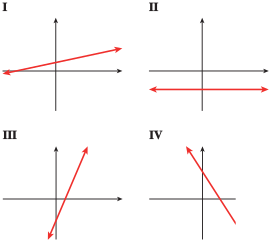
Compute the slope of the line in Problems 23–26. Note the scales on the axes.
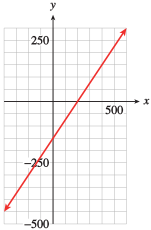
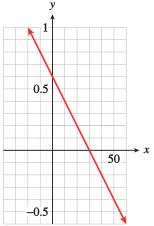
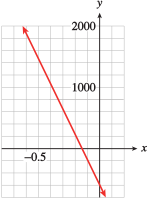
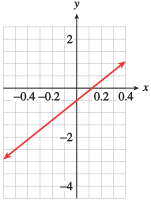
Each table in Problems 27–30 gives the coordinates of points on a line.
- Find the slope of the line.
- Fill in the missing table entries.
A temporary typist's paycheck (before deductions) is given, in dollars, by , where is the number of hours she worked.
- Make a table of values for the function.
- Graph the function.
- Using two points on the graph, compute the slope , including units.
- What does the slope tell us about the typist's paycheck?
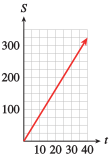
- 8 dollars/hour
- The typist is paid $ per hour.
The distance (in miles) covered by a cross-country competitor is given by , where is the number of hours she runs.
- Make a table of values for the function.
- Graph the function.
- Using two points on the graph, compute the slope , including units.
- What does the slope tell us about the cross-country runner?
In Problems 33–40,
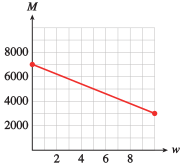
- Choose two points and compute the slope of the graph (including units).
- Explain what the slope measures in the context of the problem.
The graph shows the number of barrels of oil, , that has been pumped at a drill site days after a new drill is installed.
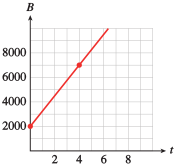
- barrels/day
- The slope indicates that oil is pumped at a rate of barrels per day.
The graph shows the amount of garbage, (in tons), that has been deposited at a dump site years after new regulations go into effect.
The graph shows the amount of emergency water, (in liters), remaining in a southern California household days after an earthquake.
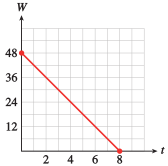
- liters/day
- The slope indicates that the water is diminishing at a rate of liters per day.
The graph shows the amount of money, (in dollars), in Tammy's bank account weeks after she loses all sources of income.
The graph shows the length in inches, , corresponding to various lengths in feet .
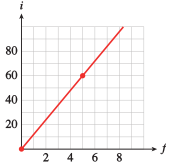
- inches/foot
- The slope gives the conversion rate of 12 inches per foot.
The graph shows the number of ounces, , that correspond to various weights measured in pounds, .
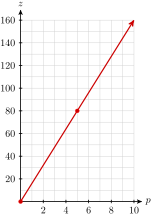
The graph shows the cost, (in dollars), of coffee beans in terms of the amount of coffee, (in kilograms).
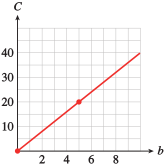
- dollars/kilogram
- The slope gives the unit price of per kilogram
The graph shows Tracey's earnings, (in dollars), in terms of the number of hours, , that she babysits.
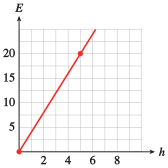
Which of the tables in Problems 41 and 42 represent variables that are related by a linear function? (Hint: Which relationships have constant slope?)
(a)
The table shows the amount of ammonium chloride salt, in grams, that can be dissolved in 100 grams of water at different temperatures.
| Temperature,C | |||||||
|---|---|---|---|---|---|---|---|
| Grams of salt |
- If you plot the data, will the points lie on a straight line? Why or why not?
- Calculate the rate of change of salt dissolved with respect to temperature.
- Yes, the slope between any two points is .
- grams of salt per degree Celsius
A spring is suspended from the ceiling. The table shows the length of the spring, in centimeters, as it is stretched by hanging various weights from it.
| Weight, kg | |||||||
|---|---|---|---|---|---|---|---|
| Length, cm |
- If you plot the data, will the points lie on a straight line? Why or why not?
- Calculate the rate of change of length with respect to weight.
The table gives the radius and circumference of various circles, rounded to three decimal places.
- If we plot the data, will the points lie on a straight line?
- What familiar number does the slope turn out to be? (Hint: Recall a formula from geometry.)
- Yes
The table gives the side and the diagonal of various squares, rounded to three decimal places.
- If we plot the data, will the points lie on a straight line?
- What familiar number does the slope turn out to be? (Hint: Draw a picture of one of the squares and use the Pythagorean theorem to compute its diagonal.)
Geologists can measure the depth of the ocean at different points using a technique called echo-sounding. Scientists on board a ship send a pulse of sound toward the ocean floor and measure the time interval until the echo returns to the ship. The speed of sound in seawater is about meters per second.
- Write the speed of sound as a ratio.
- If the echo returns in seconds, what is the depth of the ocean at that point?
- meters
Niagara Falls was discovered by Father Louis Hennepin in 1682. In 1952, much of the water of the Niagara River was diverted for hydroelectric power, but until that time erosion caused the Falls to recede upstream by feet per year.
- How far did the Falls recede from 1682 to 1952?
- The Falls were formed about years ago during the end of the last ice age. How far downstream from their current position were they then? (Give your answer in miles.)
Geologists calculate the speed of seismic waves by plotting the travel times for waves to reach seismometers at known distances from the epicenter. The speed of the wave can help them determine the nature of the material it passes through. The graph shows a travel-time graph for P-waves from a shallow earthquake.
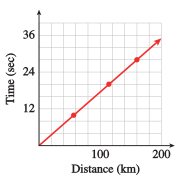
- Why do you think the graph is plotted with distance as the input variable?
- Use the graph to calculate the speed of the wave.
- The distances are known.
- km per second
Energy (supplied by heat) is required to raise the temperature of a substance, and it is also needed to melt a solid substance to a liquid. The table shows data from heating a solid sample of stearic acid. Heat was applied at a constant rate throughout the experiment. (Source: J. A. Hunt and A. Sykes, 1984)
| Time (minutes | |||||||||||||||
|---|---|---|---|---|---|---|---|---|---|---|---|---|---|---|---|
| Temperature, C |
- Did the temperature rise at a constant rate? Describe the temperature as a function of time.
- Graph temperature as a function of time.
- What is the melting point of stearic acid? How long did it take the sample to melt?
The graph shows the temperature of the ocean as a function of depth.
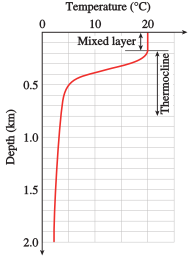
- What is the difference in temperature between the surface of the ocean and the deepest level shown?
- Over what depths does the temperature change most rapidly?
- What is the average rate of change of temperature with respect to depth in the region called the thermocline?
- About C
- 0.3 km to 0.4 km
- About C per kilometer
The graph shows the average air temperature as a function of altitude. (Figure (b) is an enlargement of the indicated region of Figure (a).) (Source: Ahrens, 1998)
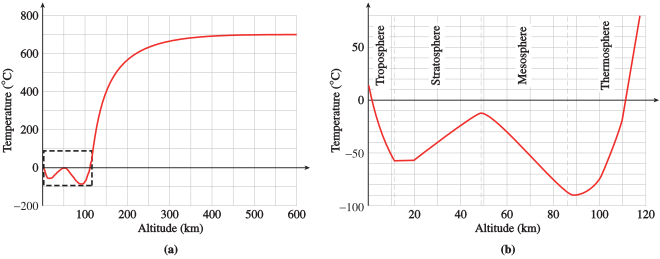
- Is temperature a decreasing function of altitude?
- The lapse rate is the rate at which the temperature changes with altitude. In which regions of the atmosphere is the lapse rate positive?
- The region where the lapse rate is zero is called the isothermal zone. Give an interval of altitudes that describes the isothermal zone.
- What is the lapse rate in the mesosphere?
- Describe the temperature for altitudes greater than 90 kilometers.
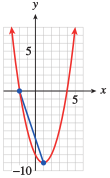
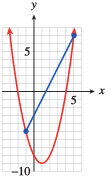
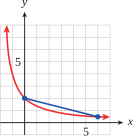
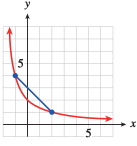
In Problems 53–56, evaluate the function at and , and then find the slope of the line segment joining the two corresponding points on the graph. Illustrate the line segment on a graph of the function.
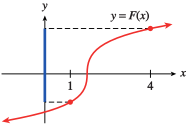
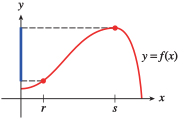
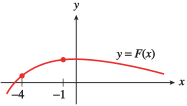
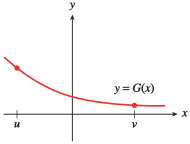
In Problems 57–62, find the coordinates of the indicated points, then write an algebraic expression using function notation for the indicated quantity.
The length of the vertical line segment on the -axis
- ;
- ;
The length of the vertical line segment on the -axis
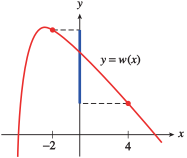
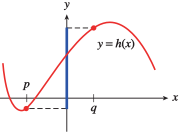
- The increase in as increases from to
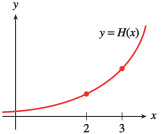
- The increase in as increases from to
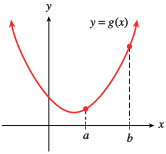
- ;
- ;
- The increase in as increases from to
- The increase in as increases from to
The shaded area
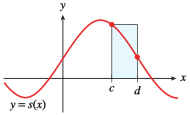
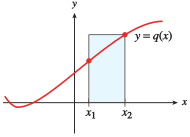
- ;
- ;
The shaded area
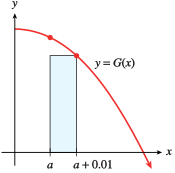
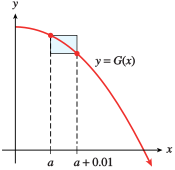
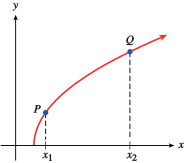
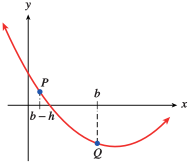
In Problems 63–66, find the coordinates of the indicated points on the graph of and write an algebraic expression using function notation for the slope of the line segment joining points and .
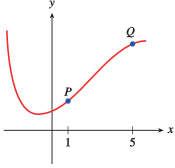
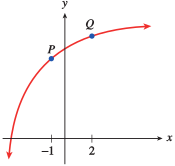
- ;
- ;
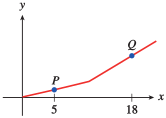
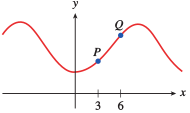
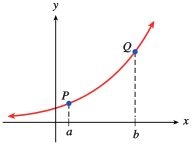
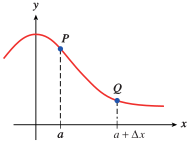
- ;
- ;
Modeling, Functions, and Graphs by Katherine Yoshiwara (yoshiwarabooks.org), GNU Free Documentation License 1.2 or later. Adapted for the XYZ HTML edition with the authors' permission (recorded 2026-07-04). License: GFDL-1.2-or-later.