
1.2 Functions
Definition of Function
We often want to predict values of one variable from the values of a related variable. For example, when a physician prescribes a drug in a certain dosage, she needs to know how long the dose will remain in the bloodstream. A sales manager needs to know how the price of his product will affect its sales. A function is a special type of relationship between variables that allows us to make such predictions.
Suppose it costs $800 for flying lessons, plus $30 per hour to rent a plane. If we let represent the total cost for hours of flying lessons, then
Thus, for example
| when | , | |
|---|---|---|
| when | , | |
| when | , |
The variable is called the input or independent variable, and is the output or dependent variable, because its values are determined by the value of . We can display the relationship between two variables by a table or by ordered pairs. The input variable is the first component of the ordered pair, and the output variable is the second component.
For this relationship, we can find the value of for any given value of . All we have to do is substitute the value of into the equation and solve for . Note that there can be only one value of for each value of .
- As part of a project to improve the success rate of freshmen, the counseling department studied the grades earned by a group of students in English and algebra. Do you think that a student's grade in algebra is a function of his or her grade in English? _____
Explain why or why not.
_____ - Phatburger features a soda bar, where you can serve your own soft drinks in any size. Do you think that the number of calories in a serving of Zap Kola is a function of the number of fluid ounces? _____
Explain why or why not.
_____
- No, students with the same grade in English can have different grades in algebra.
- Yes, the number of calories is proportional to the number of fluid ounces.
- As part of a project to improve the success rate of freshmen, the counseling department studied the grades earned by a group of students in English and algebra. Do you think that a student's grade in algebra is a function of his or her grade in English? Explain why or why not.
- Phatburger features a soda bar, where you can serve your own soft drinks in any size. Do you think that the number of calories in a serving of Zap Kola is a function of the number of fluid ounces? Explain why or why not.
- No, students with the same grade in English can have different grades in algebra.
- Yes, the number of calories is proportional to the number of fluid ounces.
What distinguishes a function from other variable relationships?
_____
There cannot be two output values for a single input value.
What distinguishes a function from other variable relationships?
- The variables are related by a formula.
- The values of the input and output variables must be different.
- There cannot be two output values for a single input value.
- There cannot be two input values for a single output value.
A function can be described in several different ways. In the following examples, we consider functions defined by tables, by graphs, and by equations.
Functions Defined by Tables
When we use a table to describe a function, the first variable in the table (the left column of a vertical table or the top row of a horizontal table) is the input variable, and the second variable is the output. We say that the output variable is a function of the input.
Decide whether each table describes as a function of . Explain your choice.
Is a function of ? _____
_____
Is a function of ? _____
_____
- No, for example, corresponds both to and also to .
- Yes, each value of has exactly one value of associated with it.
Decide whether each table describes as a function of . Explain your choice.
- No, for example, corresponds both to and also to .
- Yes, each value of has exactly one value of associated with it.
How would you know if a table of values does not come from a function?
_____
Two different output values have the same input value.
How would you know if a table of values does not come from a function?
- The output values are all the same.
- The input values are not evely spaced.
- Two different input values have the same output value.
- Two different output values have the same input value.
Functions Defined by Graphs
We can also use a graph to define a function. The input variable is displayed on the horizontal axis, and the output variable on the vertical axis.
The graph shows the elevation in feet, , of the Los Angeles Marathon course at a distance miles into the race. (Source: Los Angeles Times, March 3, 2005)
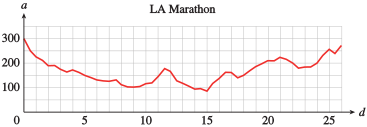
- Which variable is the input, and which is the output?
_____ - What is the elevation at mile 20?
Answer: _____ feet - At what distances is the elevation 150 feet?
The relevant distances (to the nearest half-mile) separated by commas: _____ miles - What are the maximum and minimum values of , and when do these values occur?
The maximum elevation is _____ feet which occurs at _____. - The runners pass by the Los Angeles Coliseum at about 4.2 miles into the race. What is the elevation there?
Approximately (within 5) _____ feet
- The input variable is , and the output variable is .
- Approximately 210 feet
- Approximately where , , , , , and
- The maximum value of 300 feet occurs at the start, when . The minimum of 85 feet occurs when .
- Approximately 165 feet
The graph shows the elevation in feet, , of the Los Angeles Marathon course at a distance miles into the race. (Source: Los Angeles Times, March 3, 2005)
- Which variable is the input, and which is the output?
- What is the elevation at mile 20?
- At what distances is the elevation 150 feet?
- What are the maximum and minimum values of , and when do these values occur?
- The runners pass by the Los Angeles Coliseum at about 4.2 miles into the race. What is the elevation there?
- The input variable is , and the output variable is .
- Approximately 210 feet
- Approximately where , , , , , and
- The maximum value of 300 feet occurs at the start, when . The minimum of 85 feet occurs when .
- Approximately 165 feet
Functions Defined by Equations
Example illustrates a function defined by an equation.
Write an equation that gives the volume, , of a sphere as a function of its radius, .
_____
Note: Use "pi" to enter the number .
Write an equation that gives the volume, , of a sphere as a function of its radius, .
Name three ways to describe a function.
_____
By tables, equations, or graphs
Name three ways to describe a function.
- By inputs, outputs, or evaluation
- By tables, equations, or graphs
- By the intercepts, the slope, or the vertex
- By numbers, letters, or diagrams
Write one question you still have about functions.
_____
Write one question you still have about functions.
Function Notation
There is a convenient notation for discussing functions. First, we choose a letter, such as , , or (or , , or ), to name a particular function. (We can use any letter, but these are the most common choices.)
For instance, in Example, the height, , of a falling algebra book is a function of the elapsed time, . We might call this function . In other words, is the name of the relationship between the variables and . We write
which means " is a function of , and is the name of the function."
With this new notation we may write
or just
instead of
to describe the function.
Remember that when we write , the symbol is just another name for the output variable.
True or False.
- The notation indicates the product of and . _____
- If , then gives the value of the input variable. _____
- If is a function of , we may write . _____
- In the equation the letters and are variables. _____
- False
- False
- False
- False
Decide whether each statement is true or false.
- The notation indicates the product of and .
- If , then gives the value of the input variable.
- If is a function of , we may write .
- In the equation the letters and are variables.
Let be the name of the function defined by the graph in Example, the number of hours of daylight in Peoria days after January 1.
- Use function notation to state that is a function of .
_____ - What does the statement mean in the context of the problem?
_____
- The sun is above the horizon in Peoria for 9.7 hours on January 16.
Let be the name of the function defined by the graph in Example, the number of hours of daylight in Peoria days after January 1.
- Use function notation to state that is a function of .
- What does the statement mean in the context of the problem?
- The sun is above the horizon in Peoria for 9.7 hours on January 16.
Use function notation to write the statement " defines as a function of ."
_____
Use function notation to write the statement " defines as a function of ."
Using Function Notation
Finding the value of the output variable that corresponds to a particular value of the input variable is called evaluating the function.
When you exercise, your heart rate should increase until it reaches your target heart rate. The table shows target heart rate, , as a function of age.
| 20 | 25 | 30 | 35 | 40 | 45 | 50 | 55 | 60 | 65 | 70 | |
|---|---|---|---|---|---|---|---|---|---|---|---|
| 150 | 146 | 142 | 139 | 135 | 131 | 127 | 124 | 120 | 116 | 112 |
- Find and .
_____
_____ - Find a value of for which .
_____
- ,
When you exercise, your heart rate should increase until it reaches your target heart rate. The table shows target heart rate, , as a function of age.
| 20 | 25 | 30 | 35 | 40 | 45 | 50 | 55 | 60 | 65 | 70 | |
|---|---|---|---|---|---|---|---|---|---|---|---|
| 150 | 146 | 142 | 139 | 135 | 131 | 127 | 124 | 120 | 116 | 112 |
- Find and .
- Find a value of for which .
- ,
If , what are the input and output variables?
_____
is the input and is the output
If , what are the input and output variables?
- is the output and is the input.
- is the output and is the input.
- is the input and is the output.
- is the output and is the input.
If a function is described by an equation, we simply substitute the given input value into the equation to find the corresponding output, or function value.
Complete the table displaying ordered pairs for the function . Evaluate the function to find the corresponding -value for each value of .
| _____ | ||
| _____ | ||
| _____ | ||
| _____ |
Complete the table displaying ordered pairs for the function . Evaluate the function to find the corresponding -value for each value of .
To simplify the notation, we sometimes use the same letter for the output variable and for the name of the function. In the next example, is used in this way.
The volume of a sphere of radius centimeters is given by
Evaluate and explain what it means.
Note: You may use "pi" to enter the number .
_____, which represents
_____
is the volume of a sphere whose radius is 10 cm.
The volume of a sphere of radius centimeters is given by
Evaluate and explain what it means.
is the volume of a sphere whose radius is 10 cm.
Do linear equations and quadratic equations define functions? Why or why not?
_____
Do linear equations and quadratic equations define functions? Why or why not?
Operations with Function Notation
Sometimes we need to evaluate a function at an algebraic expression rather than at a specific number.
A spherical balloon has a radius of 10 centimeters.
- If we increase the radius by centimeters, what will the new volume be?
_____ - If , how much did the volume increase? Round your answer to hundredths.
It increased by _____ .
Note: Use "pi" to enter the number .
- From to is an increase of about
A spherical balloon has a radius of 10 centimeters.
- If we increase the radius by centimeters, what will the new volume be?
- If , how much did the volume increase? Round your answer to hundredths.
- From to is an increase of about
Define the function . Which of these is equal to ?
_____
Define the function . Which of these is equal to ?
Let and evaluate each expression.
- _____
- _____
- _____
Let and evaluate each expression.
Explain why is not the same as for most functions.
_____
Explain why is not the same as for most functions.
Section Summary
Vocabulary
Look up the definitions of new terms in the Glossary.
- Function
- Input variable
- Independent variable
- Function value
- Dependent variable
- Output variable
CONCEPTS
- A function is a rule that assigns to each value of the input variable a unique value of the output variable.
- Functions may be defined by words, tables, graphs, or equations.
- Function notation: , where is the input and is the output.
STUDY QUESTIONS
- What property makes a relation between two variables a function?
- Name three ways to define a function.
- Give an example of a function in which two distinct values of the input variable correspond to the same value of the output variable.
- Use function notation to write the statement " defines as a function of ."
- Give an example of a function for which .
SKILLS
Practice each skill in the Homework problems listed.
- Decide whether a relationship between two variables is a function: #1–26
- Evaluate a function defined by a table, a graph, or an equation: #27–54
- Choose appropriate scales for the axes: #5–12
- Interpret function notation: #31–34, 49–54
- Simplify expressions involving function notation: #59–76
Homework 1.2
For which of Problems 1–6 is the second quantity a function of the first? Explain your answers.
Price of an item; sales tax on the item at 4%
Function; the tax is determined by the price of the item.
Time traveled at constant speed; distance traveled
Number of years of education; annual income
Not a function; incomes may differ for same number of years of education.
Distance flown in an airplane; price of the ticket
Volume of a container of water; the weight of the water
Function; weight is determined by volume.
Amount of a paycheck; amount of Social Security tax withheld
Each of the objects in Problems 7–14 establishes a correspondence between two variables. Suggest appropriate input and output variables and decide whether the relationship is a function.
An itemized grocery receipt
Input: items purchased; output: price of item. Yes, a function because each item has only one price.
An inventory list
An index
Input: topics; output: page or pages on which topic occurs. No, not a function because the same topic may appear in more than one page.
A will
An instructor's grade book
Input: students’ names; output: students’ scores on quizzes, tests, etc. No, not a function because the same student can have different grades on different tests.
An address book
A bathroom scale
Input: person stepping on scales; output: person's weight. Yes, a function because a person cannot have two different weights at the same time.
A radio dial
Which of the tables in Problems 15–26 define the second variable as a function of the first variable? Explain why or why not.
No
Yes
Yes
| Pressure () | Volume () |
|---|---|
Yes
| Frequency () | Wavelength () |
|---|---|
| Temperature () | Humidity () |
|---|---|
| Jan. 1 F | |
| Jan. 2 F | |
| Jan. 3 F | |
| Jan. 4 F | |
| Jan. 5 F | |
| Jan. 6 F | |
| Jan. 7 F |
No
| Inflation rate () | Unemployment rate () |
|---|---|
| 1972 | |
| 1973 | |
| 1974 | |
| 1975 | |
| 1976 | |
| 1977 | |
| 1978 |
| Adjusted gross income () | Tax bracket () |
|---|---|
| $ | |
| $ | |
| $ | |
| $ | |
| $ | |
| $ | |
| $ |
Yes
| Cost of merchandise () | Shipping charge () |
|---|---|
| Over |
The function described in Problem 21 is called , so that . Find the following:
- so that
The function described in Problem 22 is called , so that . Find the following:
- so that
The function described in Problem 25 is called , so that . Find the following:
- so that
- $7010–$9169
The function described in Problem 26 is called , so that . Find the following:
- so that
Data indicate that U.S. women are delaying having children longer than their counterparts 50 years ago. The table shows the percent of 20–24-year-old women in year who had not yet had children. (Source: U.S. Dept of Health and Human Services)
| Year () | |||||||||
|---|---|---|---|---|---|---|---|---|---|
| Percent of women |
- Evaluate and explain what it means.
- Estimate a solution to the equation and explain what it means.
- In 1997, of 20–24-year-old women had not yet had children. Write an equation with function notation that states this fact.
- : In 1985, of 20–24 year old women had not yet had children.
- 1987: Approximately of 20–24 year old women had not yet had children in 1987.
The table shows , the death rate (per 100,000 people) from HIV among 15–24-year-olds, and , the death rate from HIV among 25–34-year-olds, for selected years from 1997 to 2002. (Source: U.S. Dept of Health and Human Services)
| Year | ||||||||||
|---|---|---|---|---|---|---|---|---|---|---|
| 15–24-year-olds | ||||||||||
| 25–34-year-olds |
- Evaluate and explain what it means.
- Find a solution to the equation and explain what it means.
- In 1988, the death rate from HIV for 25–34-year-olds was times the corresponding rate for 15–24-year-olds. Write an equation with function notation that states this fact.
When you exercise, your heart rate should increase until it reaches your target heart rate. The table shows target heart rate, , as a function of age.
- Does ?
- Find a value of a for which . Is for all values of ?
- Is an increasing function or a decreasing function?
- No
- 60; no
- Decreasing
The table shows , the men's Olympic record time, and , the women's Olympic record time, as a function of the length, , of the race. For example, the women’s record in the 100 meters is 10.61 seconds, and the men’s record in the 800 meters is 1 minute, 40.91 seconds. (Source: en.wikipedia.org as of 11/11/2025)
| Distance (meters) | |||||||
|---|---|---|---|---|---|---|---|
| Men | |||||||
| Women |
- Does ? Does ?
- Find a value of for which . Is there a value of for which ?
In Problems 35–40, use the graph of the function to answer the questions.
The graph shows as a function of . stands for the number of students (in thousands) at State University who consider themselves computer literate, and represents time, measured in years since 1990.
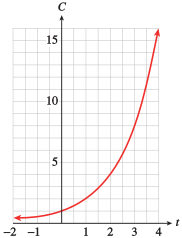
- When did students consider themselves computer literate?
- How long did it take that number to double?
- How long did it take for the number to double again?
- How many students became computer literate between January 1992 and June 1993?
- 1991
- 1 yr
- 1 yr
- About 7300
The graph shows as a function of . is the number of people in Cedar Grove who owned a portable DVD player years after 2000.
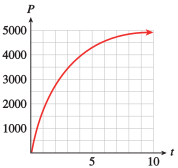
- When did 3500 people own portable DVD players?
- How many people owned portable DVD players in 2005?
- The number of owners of portable DVD players in Cedar Grove seems to be leveling off at what number?
- How many people acquired portable DVD players between 2001 and 2004?
The graph shows the revenue, , a movie theater collects as a function of the price, , it charges for a ticket.
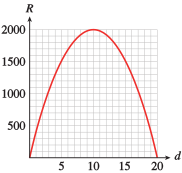
- What is the revenue if the theater charges $ for a ticket?
- What should the theater charge for a ticket in order to collect $ in revenue?
- For what values of is ?
- Approximately $
- $ or $
The graph shows as a function of . represents the weekly sales of a best-selling book, in thousands of dollars, weeks after it is released.
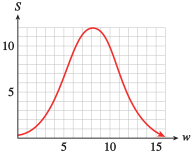
- In which weeks were sales over $?
- In which week did sales fall below $ on their way down?
- For what values of is ?
The graph shows the federal minimum wage, , as a function of time, , adjusted for inflation to reflect its buying power in 2004 dollars. (Source: www.infoplease.com)
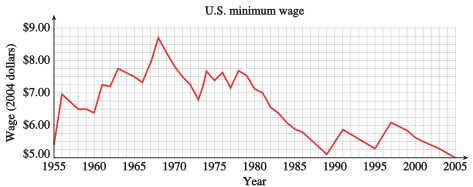
- When did the minimum wage reach its highest buying power, and what was it worth in 2004 dollars?
- When did the minimum wage fall to its lowest buying power after its peak, and what was its worth at that time?
- Give two years in which the minimum wage was worth $ in 2004 dollars.
- 1968, about $
- 1989, about $
- 1967, approximately 1970
The graph shows the U.S. unemployment rate, , as a function of time, , for the years 1985–2004. (Source: U.S. Bureau of Labor Statistics)
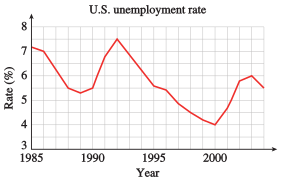
- When did the unemployment rate reach its highest value, and what was its highest value?
- When did the unemployment rate fall to its lowest value, and what was its lowest value?
- Give two years in which the unemployment rate was .
In Problems 41–48, evaluate each function for the given values.
A sport utility vehicle costs $ and depreciates according to the formula
where is the value of the vehicle after years.
- Evaluate and explain what it means.
- Solve the equation and explain what it means.
- If this year is , what does mean?
- : After 12 years, the SUV is worth $.
- : The SUV has zero value after years.
- The value 2 years later
In a profit-sharing plan, an employee receives a salary of
where represents the company's profit for the year.
- Evaluate and explain what it means.
- Solve the equation and explain what it means.
- If the company made a profit of dollars this year, what does mean?
The number of compact cars that a large dealership can sell at price is given by
- Evaluate and explain what it means.
- As increases, does increase or decrease? Why is this reasonable?
- If the current price for a compact car is , what does mean?
- : cars will be sold at a price of $.
- decreases with increasing because fewer cars will be sold when the price increases.
- represents twice the number of cars that can be sold at the current price.
A department store finds that the market value of its Christmas-related merchandise is given by
where is the number of weeks after Christmas.
- Evaluate and explain what it means.
- As increases, does increase or decrease? Why is this reasonable?
- If this week is , what does mean?
The velocity of a car that brakes suddenly can be determined from the length of its skid marks, , by
where is in feet and is in miles per hour.
- Evaluate and explain what it means.
- Estimate the length of the skid marks left by a car traveling at miles per hour.
- Write your answer to part (b) with function notation.
- is the speed of a car that left -foot skid marks.
- feet
The distance, , in miles that a person can see on a clear day from a height, , in feet is given by
- Evaluate and explain what it means.
- Estimate the height you need in order to see miles.
- Write your answer to part (b) with function notation.
The figure gives data about snowfall, air temperature, and number of avalanches on the Mikka glacier in Sarek, Lapland, in 1957. (Source: Leopold, Wolman, Miller, 1992)
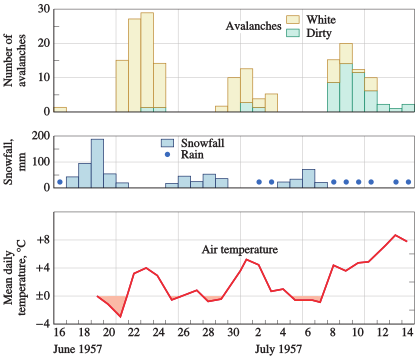
- During June and July, avalanches occurred over three separate time intervals. What were they?
- Over what three time intervals did snow fall?
- When was the temperature above freezing (C)?
- Using your answers to parts (a)–(c), make a conjecture about the conditions that encourage avalanches.
- June 21–24, June 29–July 3, July 8–14
- June 17–21, June 25–29, July 4–7
- June 22–24, June 27, June 29–July 4, July 8–14
- Avalanches occur when temperatures rise above freezing immediately after snowfall.
The bar graph shows the percent of Earth's surface that lies at various altitudes or depths below the surface of the oceans. (Depths are given as negative altitudes.) (Source: Open University)
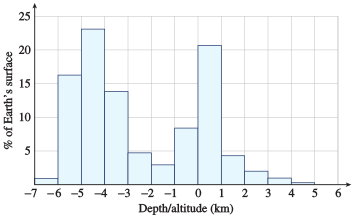
- Read the graph and complete the table.
Altitude (km) Percent of
Earth's surfaceto to to to to to to to to to to to - What is the most common altitude? What is the second most common altitude??
- Approximately what percent of the Earth's surface is below sea level?
- The height of Mt. Everest is kilometers. Can you think of a reason why it is not included in the graph?
The graph shows the temperature of the ocean at various depths. (Source: Open University)
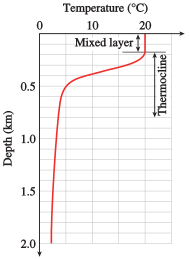
- Is depth a function of temperature?
- Is temperature a function of depth?
- The axes are scaled in an unusual way. Why is it useful to present the graph in this way?
- No
- Yes
- Moving downwards on the graph corresponds to moving downwards in the ocean.
The graph shows the relationship between annual precipitation, , in a region and the amount of erosion, measured in tons per square mile, . (Source: Leopold, Wolman, Miller, 1992)
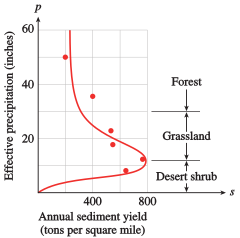
- Is the amount of erosion a function of the amount of precipitation?
- At what annual precipitation is erosion at a maximum, and what is that maximum?
- Over what interval of annual precipitation does erosion decrease?
- An increase in vegetation inhibits erosion, and precipitation encourages vegetation. What happens to the amount of erosion as precipitation increases in each of these three environments?
desert shrub: grassland: forest:
In Problems 59–64, evaluate the function and simplify.
In Problems 65–68, evaluate the function for the given expressions and simplify.
For the functions in Problems 69–76, compute the following:
For which functions does for all values of and ?
This function does NOT satisfy .
This function does NOT satisfy .
This function does NOT satisfy .
This function does NOT satisfy .
Use a table of values to estimate a solution to
as follows:
- Make a table starting at and increasing by , as shown in the accompanying tables. Find two -values and so that .
- Make a new table starting at and increasing by . Find two -values, and , so that .
- Make a new table starting at and increasing by . Find two -values, and , so that .
- Take the average of and , that is, set . Then is an approximate solution that is off by at most .
- Evaluate to check that the output is approximately .
and
and
and
Use a table of values to estimate a solution to
as follows:
- Make a table starting at and increasing by , as shown in the accompanying tables. Find two -values and so that .
- Make a new table starting at and increasing by . Find two -values, and , so that .
- Make a new table starting at and increasing by . Find two -values, and , so that .
- Take the average of and , that is, set . Then is an approximate solution that is off by at most .
- Evaluate to check that the output is approximately .
Use tables of values to estimate the positive solution to
, accurate to within .
Use tables of values to estimate the positive solution to
, accurate to within .
Modeling, Functions, and Graphs by Katherine Yoshiwara (yoshiwarabooks.org), GNU Free Documentation License 1.2 or later. Adapted for the XYZ HTML edition with the authors' permission (recorded 2026-07-04). License: GFDL-1.2-or-later.