
1.1 Linear Models
Tables, Graphs and Equations
The first step in creating a model is to describe relationships between variables. In Sales on Commission, we analyzed the relationship between Delbert's sales and his income. Starting from a verbal description, we represented the relationship in three different ways.
- A table of values displays specific data points with precise numerical values.
- A graph is a visual display of the data. It is easier to spot trends and describe the overall behavior of the variables from a graph.
- An algebraic equation is a compact summary of the model. It can be used to analyze the model and to make predictions
We begin our study of modeling with some examples of linear models. In the examples that follow, observe the interplay among the three modeling tools, and how each contributes to the model.
When you graph the data given in a table, on which axis do you show the variable in the first row of the table?
_____
The horizontal axis
When you graph the data given in a table, on which axis do you show the variable in the first row of the table?
- The linear axis
- The horizontal axis
- The vertical axis
- Both axes
Frank plants a dozen corn seedlings, each 6 inches tall. With plenty of water and sunlight they will grow approximately 2 inches per day. Complete the table of values for the height, , of the seedlings after days.
Complete the table of values for the height, of the seedlings after days.
| _____ | _____ | _____ | _____ | _____ |
- Write an equation for the height of the seedlings in terms of the number of days since they were planted.
Equation: _____ - Graph the equation.
| h0 | h1 | h2 | h3 | h4 |
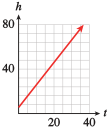
- The graph of seedling height vs time is shown below.
The graph of seedling height vs time for part (b) is shown below.
Frank plants a dozen corn seedlings, each 6 inches tall. With plenty of water and sunlight they will grow approximately 2 inches per day. Complete the table of values for the height, , of the seedlings after days.
Complete the table of values for the height, of the seedlings after days.
- Write an equation for the height of the seedlings in terms of the number of days since they were planted.
- Graph the equation.
Use your equation from Practice 1 to answer the questions. Illustrate each answer on the graph.
- How tall is the corn after Tweek weeks? Use "ft" for feet or "in" for inches.
Answer (including units): _____ - How long will it be before the corn is Hft feet tall? Use "day" for days.
Answer (including units): _____
- 48 inches tall
- 33 days
A graph is below.
The graph below illustrates the answers.
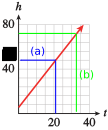
Use your equation from Practice 1 to answer the questions. Illustrate each answer on the graph.
- How tall is the corn after 3 weeks?
- How long will it be before the corn is 6 feet tall? Hint: Convert feet to inches.
- 48 inches tall
- 33 days
What is the difference between an expression and an equation?
_____
What is the difference between an expression and an equation?
Choosing Scales for the Axes
To create a useful graph, we must choose appropriate scales for the axes.
- The axes must extend far enough to show the values of the variables.
- The tick marks should be equally spaced.
- Usually we should use no more than 10 or 15 tick marks.
If is expressed in terms of , which variable goes on the horizontal axis?
_____
If is expressed in terms of , which variable goes on the horizontal axis?
Silver Lake has been polluted by industrial waste products. The concentration of toxic chemicals in the water is currently 285 parts per million (ppm). Environmental officials would like to reduce the concentration by 15 ppm each year.
- Complete the table of values showing the desired concentration, , of toxic chemicals years from now. For each -value, calculate the corresponding value for . Write your answers as ordered pairs.
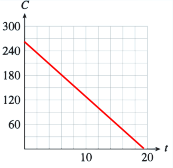
(0, _____ ) (5, _____ ) (10, _____ ) (15, _____ ) - To choose scales for the axes, notice that the value of starts at 285 and decreases from there. We'll scale the vertical axis up to 300, and use 10 tick marks at intervals of 30. Graph the ordered pairs on the grid, and connect them with a straight line.
- Write an equation for the concentration, , of toxic chemicals years from now.
Equation: _____
For part (c): The concentration is initially 285 ppm, and we subtract 15 ppm for each year that passes, or .
- The graph is shown below.
The graph for part(b):
Silver Lake has been polluted by industrial waste products. The concentration of toxic chemicals in the water is currently 285 parts per million (ppm). Environmental officials would like to reduce the concentration by 15 ppm each year.
- Complete the table of values showing the desired concentration, , of toxic chemicals years from now. For each -value, calculate the corresponding value for . Write your answers as ordered pairs.
- To choose scales for the axes, notice that the value of starts at 285 and decreases from there. We'll scale the vertical axis up to 300, and use 10 tick marks at intervals of 30. Graph the ordered pairs on the grid, and connect them with a straight line.
- Write an equation for the concentration, , of toxic chemicals years from now. Hint: The concentration is initially 285 ppm, and we subtract 15 ppm for each year that passes, or .
If , what is true about ?
_____
is less than .
If , what is true about ?
- It is greater than 3
- It is less than 3
- It is greater than 10
- It is less than
- Solve the equation for in terms of .
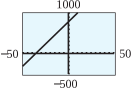
_____ - Graph the equation with a graphing utility. Use the window
Xmin Xmax Xscl Ymin Ymax Yscl - Sketch the graph on paper. Use the window settings to choose appropriate scales for the axes.
- The calculator graph is shown below.
- The graph is shown below.
The graph for (b):
c.
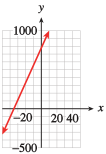
- Solve the equation for in terms of .
- Graph the equation with a graphing utility. Use the window
Xmin Xmax Xscl Ymin Ymax Yscl - Sketch the graph on paper. Use the window settings to choose appropriate scales for the axes.
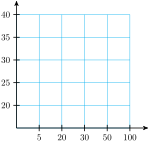
What is wrong with the grid above?
_____
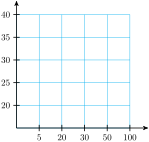
What is wrong with the grid above?
- The grid lines on the -axis are not evenly spaced.
- The scale on the -axis does not start at 0.
- The axes are not labeled with the variables.
- All of the above.
Linear Equations
All the models in the preceding examples have equations with a similar form:
(We'll talk more about rate of change in Slope and Rate of Change.) Their graphs were all portions of straight lines. For this reason such equations are called linear equations. The order of the terms in the equation does not matter. For example, the equation in Example,
can be written equivalently as
and the equation in Example,
can be written as
This form of a linear equation, , is called the general form.
In central Nebraska, each acre of corn requires 25 acre-inches of water per year, and each acre of winter wheat requires 18 acre-inches of water. (An acre-inch is the amount of water needed to cover one acre of land to a depth of one inch.) A farmer can count on 9000 acre-inches of water for the coming year. (Source: Institute of Agriculture and Natural Resources, University of Nebraska)
- Write an equation relating the number of acres of corn, , and the number of acres of wheat, , that the farmer can plant.
_____ - Complete the table. Round your answers to tenths.
_____ _____ _____ _____
In central Nebraska, each acre of corn requires 25 acre-inches of water per year, and each acre of winter wheat requires 18 acre-inches of water. (An acre-inch is the amount of water needed to cover one acre of land to a depth of one inch.) A farmer can count on 9000 acre-inches of water for the coming year. (Source: Institute of Agriculture and Natural Resources, University of Nebraska)
- Write an equation relating the number of acres of corn, , and the number of acres of wheat, , that the farmer can plant.
- Complete the table. Round your answers to tenths.
Write down two different equation forms for linear models. Which do you think is easier to use?
_____
Write down two different equation forms for linear models. Which do you think is easier to use?
Intercepts
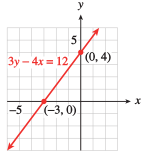
Consider the graph of the equation
shown at left. The points where the graph crosses the axes are called the intercepts of the graph. The coordinates of these points are easy to find.
The -coordinate of the -intercept is zero, so we set in the equation to get
The -intercept is the point . Also, the -coordinate of the -intercept is zero, so we set in the equation to get
The -intercept is .
What is the -coordinate of any point on the -axis?
_____
What is the -coordinate of any point on the -axis?
- It depends on the value of .
The intercepts of a graph tell us something about the situation it models.
Delbert says that the intercepts of the line are . What is wrong with his answer?
_____
All of the above
Delbert says that the intercepts of the line are . What is wrong with his answer?
- is not on the -axis.
- An intercept must have a 0 coordinate.
- The line has two intercepts.
- All of the above.
Find the intercepts of the graph in Example, about the advertising budget for Albert's Appliances: .
- Enter each intercept as an ordered pair.
The -intercept is _____.
The -intercept is _____. - What do the intercepts tell us about the problem?
The -intercept tells us:
_____
The -intercept tells us:
_____
- We find the -intercept by setting and solving for to learn that , so the -intercept is .
We find the -intercept by setting and solving for to learn that , so the -intercept is . - The -intercept has , that is, it corresponds to when there are zero radio ads. The -intercept has , that is, it corresponds to when there are zero tv ads.
- Find the intercepts of the graph in Example, about the advertising budget for Albert's Appliances: .
- What do the intercepts tell us about the problem?
- The -intercept is . The -intercept is .
- The manager can buy 20 television ads if she buys no radio ads. She can buy 60 radio ads if she buys no television ads.
Explain how the words intercept and intersect are related, and how they are different.
_____
Explain how the words intercept and intersect are related, and how they are different.
Intercept Method for Graphing Lines
Because we really only need two points to graph a linear equation, we might as well find the intercepts first and use them to draw the graph. The values of the intercepts will also help us choose suitable scales for the axes. It is always a good idea to find a third point as a check.
Is it possible for the -intercept and the -intercept of a line to be the same point?
_____
Yes
Is it possible for the -intercept and the -intercept of a line to be the same point?
How many points do you need to graph a linear equation?
_____
Two
How many points do you need to graph a linear equation?
- Two
- Three
- One in each quadrant
- It depends on the equation
In Practice 5 you wrote an equation about crops in Nebraska.
- Find the intercepts of the graph.
Note: Enter each intercept as an ordered pair.
The -intercept is _____.
The -intercept is _____. - Use the intercepts to help you choose appropriate scales for the axes, and then graph the equation.
- What do the intercepts tell us about the problem?
The -intercept tells us:
_____
The -intercept tells us:
_____
- We find the -intercept by setting and solving for to learn that , so the -intercept is .
We find the -intercept by setting and solving for to learn that , so the -intercept is . - If he plants no wheat, the farmer can plant 360 acres of corn. If he plants no corn, the farmer can plant 500 acres of wheat.
A graph is shown below.
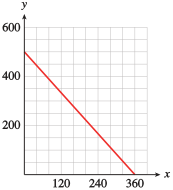
In Practice 5 you wrote an equation about crops in Nebraska.
- Find the intercepts of the graph.
- Use the intercepts to help you choose appropriate scales for the axes, and then graph the equation.
- What do the intercepts tell us about the crops?
- The -intercept is . The -intercept is .
- If he plants no wheat, the farmer can plant 360 acres of corn. If he plants no corn, the farmer can plant 500 acres of wheat.
What was the most difficult part of this section to understand? Write a question whose answer would help you understand it.
_____
What was the most difficult part of this section to understand? Write a question whose answer would help you understand it.
Section Summary
Vocabulary
Look up the definitions of new terms in the Glossary.
- Variable
- Solve an equation
- Evaluate an expression
- Linear equation
- Increasing graph
- Decreasing graph
- Intercept
- Mathematical model
CONCEPTS
- We can describe a relationship between variables with a table of values, a graph, or an equation.
- Linear models have equations of the following form:
- To make a useful graph, we must choose appropriate scales for the axes.
- The intercepts of a graph are the points where the graph crosses the axes.
- We can use the intercepts to graph a line.
- The intercepts are also useful for interpreting a model.
STUDY QUESTIONS
- Name three ways to represent a relationship between two variables.
- If is expressed in terms of , which variable goes on the horizontal axis?
- Explain the difference between evaluating an expression and solving an equation.
- How many points do you need to graph a linear equation?
- Explain how the words intercept and intersect are related; explain how they are different.
- Delbert says that the intercepts of the line are . What is wrong with his answer?
SKILLS
Practice each skill in the Homework problems listed.
- Make a table of values: #1–4, 7 and 8
- Plot points and draw a graph: #1–4, 7 and 8
- Choose appropriate scales for the axes: #5–12
- Write a linear model of the form : #1–8
- Write a linear model in general form: #25–28, 33–36
- Evaluate a linear expression, algebraically and graphically: #1–4
- Solve a linear equation, algebraically and graphically: #1–4
- Find the intercepts of a graph: #5 and 6, 13–24, 45–52
- Graph a line by the intercept method: #5 and 6, 13–24
- Interpret the meaning of the intercepts: #5 and 6, 25–28
- Use a graphing calculator to graph a line: #37–52
- Sketch on paper a graph obtained on a calculator: #37–44
Homework 1.1
The temperature in the desert at 6 a.m., just before sunrise, was F. The temperature rose degrees every hour until it reached its maximum value at about 5 p.m. Complete the table of values for the temperature, , at hours after 6 a.m.
- Write an equation for the temperature, , in terms of .
- Graph the equation.
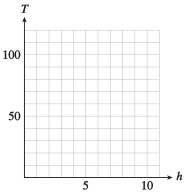
- How hot is it at noon? Illustrate the answer on your graph.
- When will the temperature be F? Illustrate the answer on your graph.
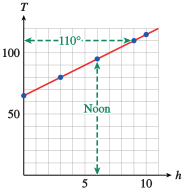
- 3 p.m.
The taxi out of Dulles Airport charges a traveler with one suitcase an initial fee of $, plus $ for each mile traveled. Complete the table of values showing the charge, , for a trip of miles.
- Write an equation for the charge, , in terms of the number of miles traveled, .
- Graph the equation.
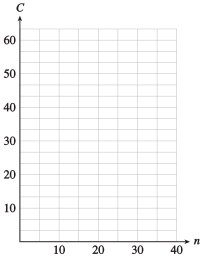
- What is the charge for a trip to Mount Vernon, miles from the airport? Illustrate the answer on your graph.
- If a ride to the National Institutes of Health (NIH) costs $, how far is it from the airport to the NIH? Illustrate the answer on your graph.
On October 31, Betty and Paul fill their -gallon oil tank for their heater. Beginning in November, they use an average of gallons of oil per week. Complete the table of values for the amount of oil, , left in the tank after weeks.
- Write an equation that expresses the amount of oil, , in the tank in terms of the number of weeks, , since October 31.
- Graph the equation.
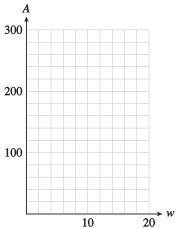
- How much did the amount of fuel oil in the tank decrease between the third week and the eighth week? Illustrate this amount on the graph.
- When will the tank contain more than gallons of fuel oil? Illustrate on the graph.
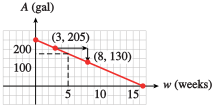
- 75 gallons
- Until the fifth week
Leon's camper has a -gallon gas tank, and he gets miles to the gallon. (That is, he uses gallon per mile.) Complete the table of values for the amount of gas, , left in Leon's tank after driving miles.
- Write an equation that expresses the amount of gas, , in Leon's fuel tank in terms of the number of miles, , he has driven.
- Graph the equation.
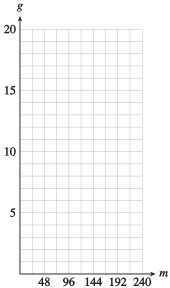
- How much gas will Leon use between 8 a.m., when his odometer reads miles, and 9 a.m., when the odometer reads miles? Illustrate on the graph.
- If Leon has less than gallons of gas left, how many miles has he driven? Illustrate on the graph.
Phil and Ernie buy a used photocopier for $ and set up a copy service on their campus. For each hour that the copier runs, Phil and Ernie make $.
- Write an equation that expresses Phil and Ernie's profit (or loss), , in terms of the number of hours, , they run the copier.
- Find the intercepts and sketch the graph. (Suggestion: Scale the horizontal axis from to in increments of , and scale the vertical axis from to in increments of .)
- What do the intercepts tell us about the profit?
- ,
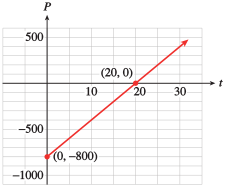
- The -intercept, , is the initial value of the profit. Phil and Ernie start out in debt. The -intercept, , is the number of hours required for Phil and Ernie to break even.
A deep-sea diver is taking some readings at a depth of feet. He begins rising at feet per minute.
- Write an equation that expresses the diver’s altitude, , in terms of the number of minutes, , elapsed. (Consider a depth of feet as an altitude of feet.)
- Find the intercepts and sketch the graph. (Suggestion: Scale the horizontal axis from to in increments of , and scale the vertical axis from to in increments of .)
- What do the intercepts tell us about the diver's depth?
There are many formulas for estimating the annual cost of driving. The Automobile Club estimates that fixed costs for a small car—including insurance, registration, depreciation, and financing—total about $ per year. The operating costs for gasoline, oil, maintenance, tires, and so forth are about cents per mile. (Source: Automobile Association of America)
- Write an equation for the annual driving cost, , in terms of , the number of miles driven.
- Complete the table of values.
Miles Driven Cost ($) - Choose scales for the axes and graph the equation.
- How much does the annual cost of driving increase when the mileage increases from to miles? Illustrate this amount on the graph.
- How much mileage will cause the annual cost to exceed $? Illustrate on the graph.
- Complete the table of values.
Miles Driven Cost ($) 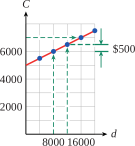
- $
- More than 16,000 miles
The boiling point of water changes with altitude. At sea level, water boils at F, and the boiling point diminishes by approximately F for each -foot increase in altitude.
- Write an equation for the boiling point, , in terms of , the altitude in feet.
- Complete the table of values.
Altitude (ft) Boiling point (F) - Choose scales for the axes and graph the equation.
- How much does the boiling point decrease when the altitude increases from to feet? Illustrate this amount on the graph.
- At what altitudes is the boiling point less than F? Illustrate on the graph.
For each table, choose appropriate scales for the axes and plot the given points.
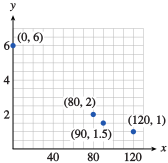
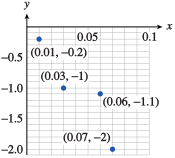
For Problems 13–18,
- Find the intercepts of the graph.
- Graph the equation by the intercept method.
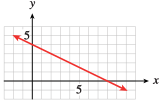
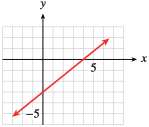
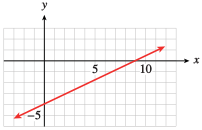
For Problems 19–24,
- Find the intercepts of the graph.
- Use the intercepts to choose scales for the axes, and then graph the equation by the intercept method.
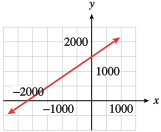
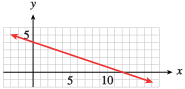
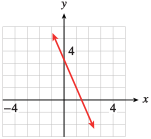
The owner of a gas station has $ to spend on unleaded gas this month. Regular unleaded costs him $ per gallon, and premium unleaded costs $ per gallon.
- How much do gallons of regular cost? How much do gallons of premium cost?
- Write an equation in general form that relates the amount of regular unleaded gasoline, , the owner can buy and the amount of premium unleaded, .
- Find the intercepts and sketch the graph.
- What do the intercepts tell us about the amount of gasoline the owner can purchase?
- $ $
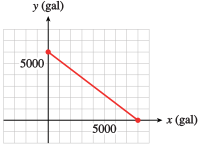
- The -intercept, gallons, is the amount of premium that the gas station owner can buy if he buys no regular. The -intercept, gallons, is the amount of regular he can buy if he buys no premium.
Five pounds of body fat is equivalent to calories. Carol can burn calories per hour bicycling and calories per hour swimming.
- How many calories will Carol burn in hours of cycling? How many calories will she burn in hours of swimming?
- Write an equation in general form that relates the number of hours, , of cycling and the number of hours, , of swimming Carol needs to perform in order to lose pounds.
- Find the intercepts and sketch the graph.
- What do the intercepts tell us about Carol's exercise program?
Delbert must increase his daily potassium intake by mg. He decides to eat a combination of figs and bananas, which are both low in sodium. There are mg potassium per gram of fig, and mg potassium per gram of banana.
- How much potassium is in grams of fig? How much potassium is in grams of banana?
- Write an equation in general form that relates the number of grams, , of fig and the number of grams, , of banana Delbert needs to get mg of potassium.
- Find the intercepts and sketch the graph.
- What do the intercepts tell us about Delbert's diet?
- mg, mg
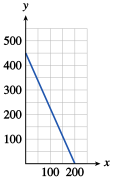
- The -intercept, grams, tells how much fig Delbert should eat if he has no bananas, and the -intercept, grams, tells how much banana he should eat if he has no figs.
Leslie plans to invest some money in two CD accounts. The first account pays interest per year, and the second account pays interest per year. Leslie would like to earn $ per year on her investment.
- If Leslie invests dollars in the first account, how much interest will she earn? How much interest will she earn if she invests dollars in the second account?
- Write an equation in general form that relates and if Leslie earns interest.
- Find the intercepts and sketch the graph.
- What do the intercepts tell us about Leslie's investments?
Find the intercepts of the graph for each equation.
e. Why is the equation called the intercept form for a line?
- The value of is the -intercept, and the value of is the -intercept.
Write an equation in intercept form (see Problem 29) for the line with the given intercepts. Then write the equation in general form.
- Find the -intercept of the line .
- Find the -intercept of the line .
- , if
- Find the -intercept of the line .
- Find the -intercept of the line .
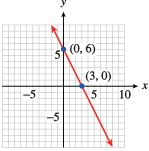
Write an equation in general form for each line.
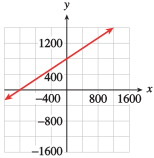
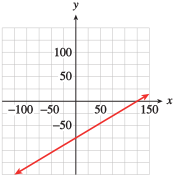
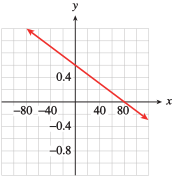
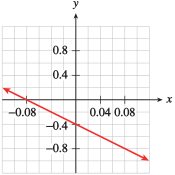
For Problems 37–44,
- Solve each equation for in terms of . (See the Algebra Skills Refresher Linear Equations and Inequalities to review this skill.)
- Graph the equation with your graphing utility in the specified window.
- Make a pencil and paper sketch of the graph. Label the scales on your axes, and the coordinates of the intercepts.
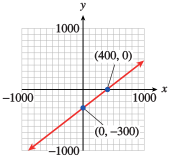
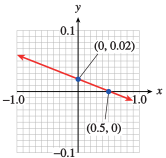
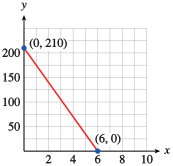
For Problems 45–52,
- Find the - and -intercepts.
- Solve the equation for .
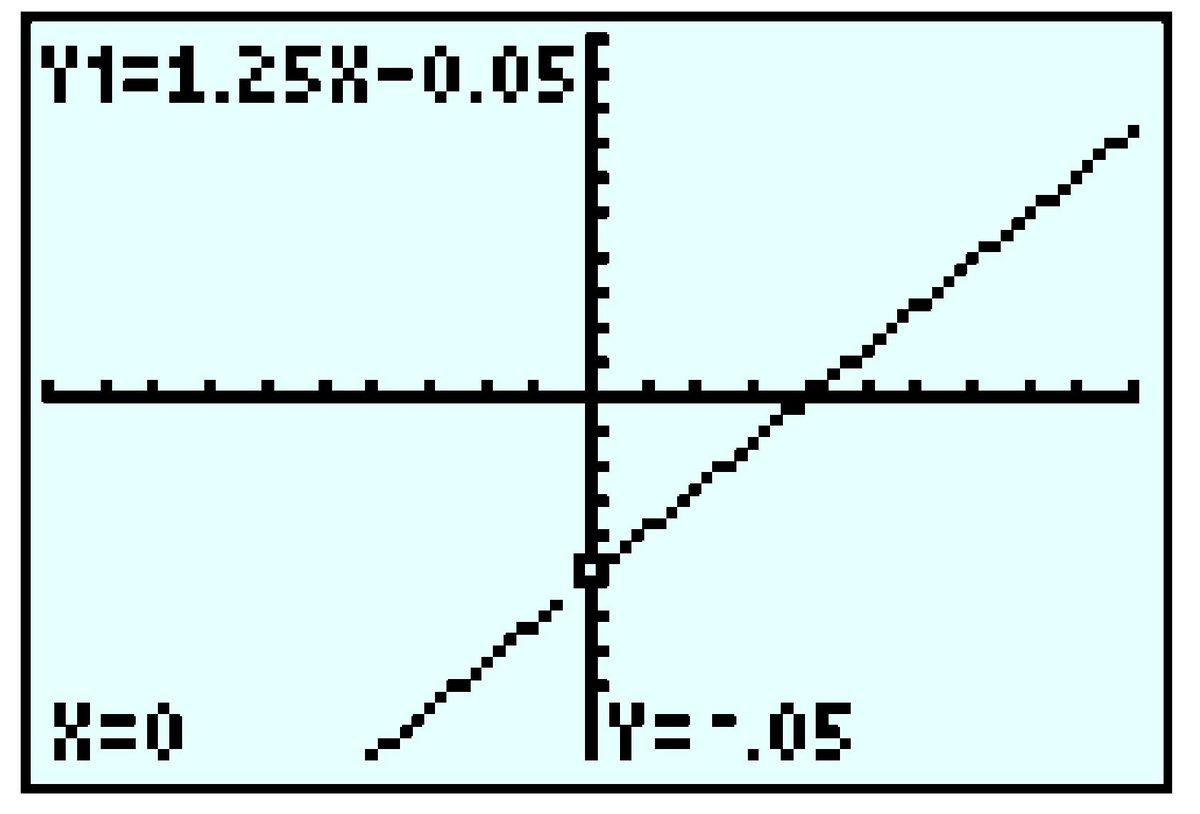
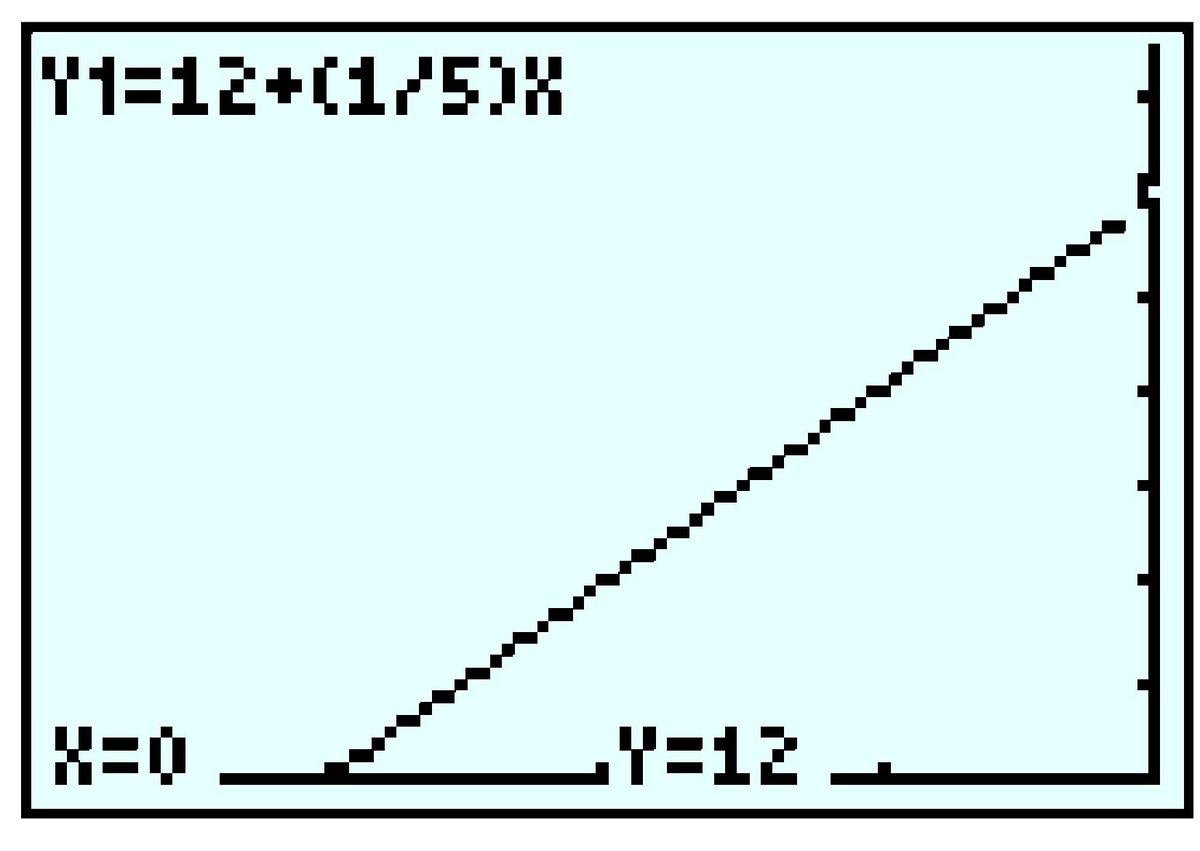
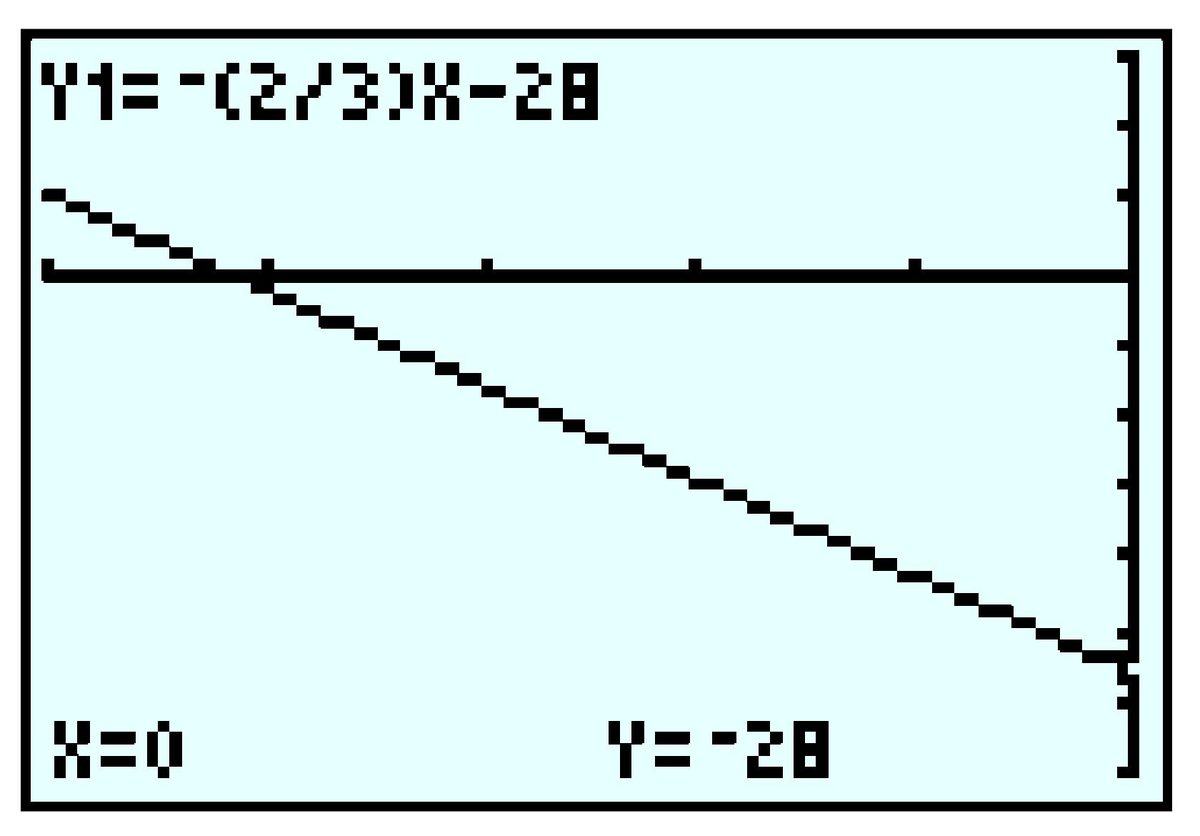
- Choose a graphing window in which both intercepts are visible, and graph the equation with your graphing utility.
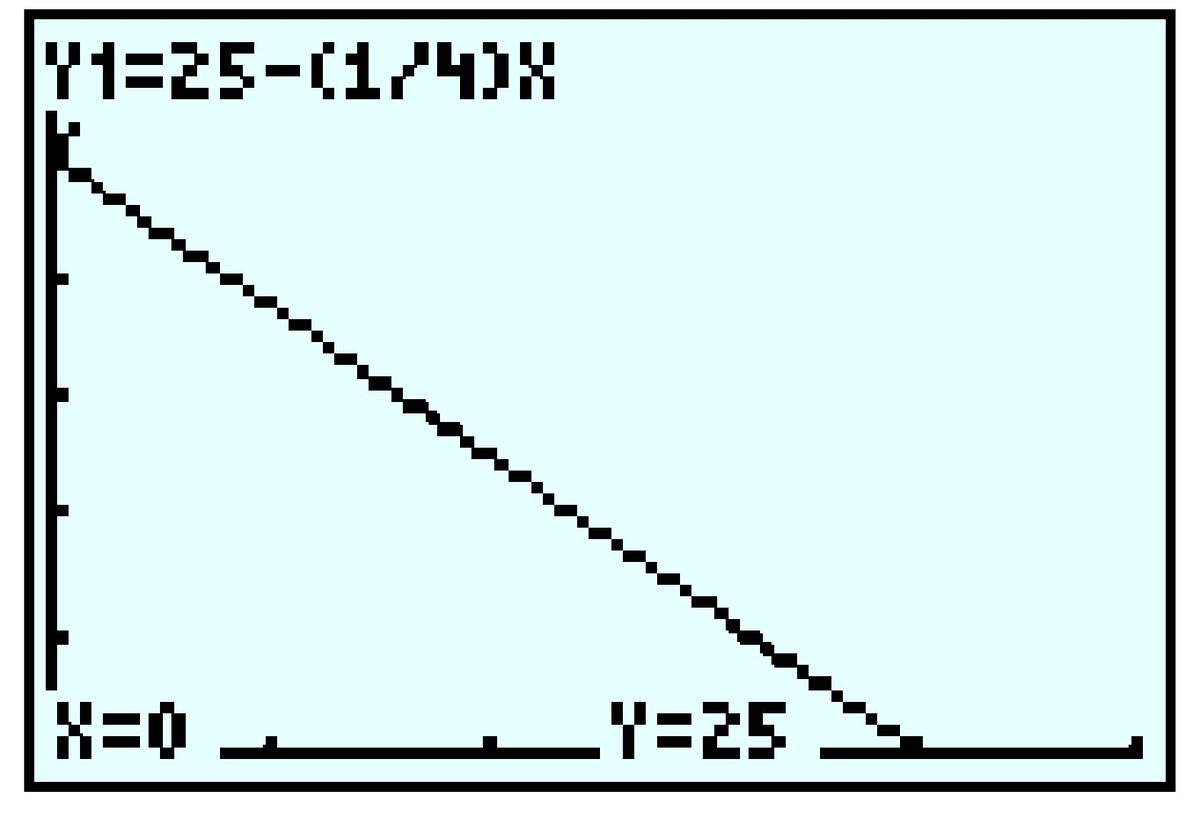
Modeling, Functions, and Graphs by Katherine Yoshiwara (yoshiwarabooks.org), GNU Free Documentation License 1.2 or later. Adapted for the XYZ HTML edition with the authors' permission (recorded 2026-07-04). License: GFDL-1.2-or-later.