
1.3 Graphs of Functions
Reading Function Values from a Graph
The Dow-Jones Industrial Average (DJIA) gives the average of the stock prices of 30 major companies. The graph below shows the DJIA as a function of time during the stock market correction of October 1987. The DJIA is thus , recorded at noon on day of October.
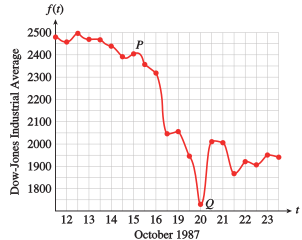
The values of the input variable, time, are displayed on the horizontal axis, and the values of the output variable, DJIA, are displayed on the vertical axis. There is no formula that gives the DJIA for a particular day; but it is still a function, defined by its graph. The value of is specified by the vertical coordinate of the point with the given -coordinate.
Thus, the coordinates of each point on the graph of the function represent a pair of corresponding values of the two variables.
Write an equation that says that the point lies on the graph of .
_____
Which equation says that the point lies on the graph of ?
The water level in Lake Huron alters unpredictably over time. The graph below gives the average water level, , in meters in the year over a 20-year period. (Source: The Canadian Hydrographic Service)
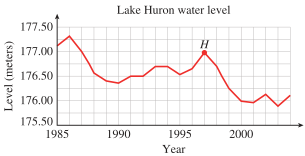
- The coordinates of point on the graph are . What do the coordinates tell you about the function ?
_____ - The average water level in was meters. Write this fact in function notation. What can you say about the graph of ?
_____
- ; the average water level was meters in .
- . The point lies on the graph of .
The water level in Lake Huron alters unpredictably over time. The graph below gives the average water level, , in meters in the year over a 20-year period. (Source: The Canadian Hydrographic Service)
- The coordinates of point on the graph are . What do the coordinates tell you about the function ?
- The average water level in was meters. Write this fact in function notation. What can you say about the graph of ?
- ; the average water level was meters in .
- . The point lies on the graph of .
Here is another way of describing how a graph depicts a function.
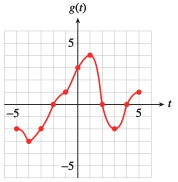
Refer to the graph of the function shown in Example.
- _____
- List the value(s) of for which . Separate different values with commas.
_____ - What is the smallest, or minimum, value of ?
Minimum: _____
For what value of does the function take on its minimum value?
_____ - Select all the intervals listed below where is decreasing.
From to ? _____
From to ? _____
From 2 to 4? _____
From 1 to 3? _____
- ;
- and
Refer to the graph of the function shown in Example.
- Find .
- For what value(s) of is ?
- What is the smallest, or minimum, value of ? For what value of does the function take on its minimum value?
- On what intervals is is decreasing?
- ;
- and
Which of the following is true?
_____
The maximum value of may occur at two different -values.
Which of the following statements is true?
- It is not possible for the function to take on the same -value at two different -values.
- The maximum value of may occur at two different -values.
- The maximum value of the function is the largest -value that appears on the graph.
- at the -intercept of .
Constructing the Graph of a Function
Although some functions are defined by their graphs, we can also construct graphs for functions described by tables or equations. We make these graphs the same way we graph equations in two variables: by plotting points whose coordinates satisfy the equation.
How do we find the value of from a graph of ?
_____
Find 3 on the -axis, move vertically to the point, then horizontally to the -axis.
How do we find the value of from a graph of ?
- Find 3 on the -axis, move vertically to the corresponding point on the graph, then horizontally to the -axis.
- Find 3 on the -axis, move horizontally to the corresponding point on the graph, then vertically to the -axis.
- Substitute 3 for into the formula for the function.
- Substitute 3 for into the formula for the function.
Let
Complete the table of values and sketch a graph of the function.
| _____ | _____ | _____ | _____ | _____ | _____ | _____ |
The graph is shown below.
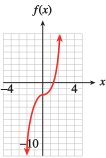
~Let
Complete the table of values and sketch a graph of the function.
We evaluate the function at each value of . For example,
You can verify the completed table and the graph with your technology tools.
How is graphing a function different from graphing an equation?
_____
How is graphing a function different from graphing an equation?
The Vertical Line Test
In a function, two different outputs cannot be related to the same input. This restriction means that two different ordered pairs cannot have the same first coordinate. What does it mean for the graph of the function?
Consider the graph shown in figure (a) below. Every vertical line intersects the graph in at most one point, so there is only one point on the graph for each -value. This graph represents a function.
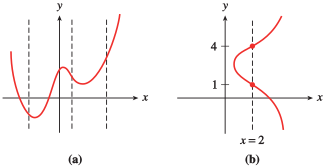
In figure (b), however, the line intersects the graph at two points, and . Two different -values, and , are related to the same -value, . This graph cannot be the graph of a function.
We summarize these observations as follows.
What does the vertical line test tell us?
_____
The vertical line test tells us if the graph is a function.
What does the vertical line test tell us?
- If the graph is a vertical line.
- If the graph is increasing.
- If the graph is decreasing.
- If the graph is a function.
Use the vertical line test to determine which of the graphs below represent functions.
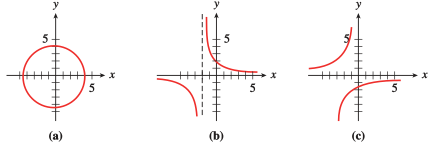
_____
Only (b) is a function.
Use the vertical line test to determine which of the graphs below represent functions.
Only (b) is a function.
Graphical Solution of Equations and Inequalities
The graph of an equation in two variables is just a picture of its solutions. When we read the coordinates of a point on the graph, we are reading a pair of - and -values that make the equation true.
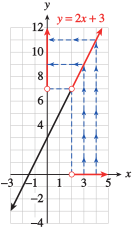
For example, the point lies on the graph of shown at right, so we know that the ordered pair is a solution of the equation . You can verify algebraically that and satisfy the equation:
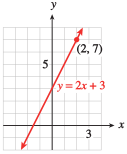
We can also say that is a solution of the one-variable equation . In fact, we can use the graph of to solve the equation for any value of . Thus, we can use graphs to find solutions to equations in one variable.
If , what point lies on the graph of ?
_____
If , what point lies on the graph of ?
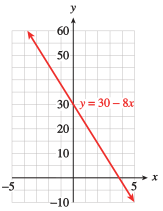
- Use the graph of shown above to solve the equation
_____ - Verify your solution algebraically.
- The point on the graph where the -coordinate is 50 is the point , so is the solution.
- We verify that we have an identity when we substitute into the equation .
For part (b):
We verify that we have an identity when we substitute into the equation .
- Use the graph of shown above to solve the equation
- Verify your solution algebraically.
- The point on the line where the -coordinate is is the point , so is the solution.
- We verify that we have an identity when we substitute into the equation .
In a similar fashion, we can solve inequalities with a graph.
Consider again the graph of , shown at right. We saw that is the solution of the equation . When we use as the input for the function , the output is . Which input values for produce output values greater than ?
You can see that -values greater than produce -values greater than , because points on the graph with -values greater than have -values greater than . Thus, the solutions of the inequality are . You can verify this result by solving the inequality algebraically.
You are using a graph of to solve the inequality . You find that . Your answer is:
_____
You are using a graph of to solve the inequality . You find that . What is the solution to the inequality?
Here is the graph from Practice 5 (Practice 5).
- Use the graph of above to solve the inequality
Answer: _____
Note: Use "" for the symbol, and use "" for . - Solve the inequality algebraically.
- As we found in the previous Checkpoint, the point on where occurs when . The -coordinates are smaller as we move to the right on the graph, that is, for the points where .
Here is the graph from Practice 5 (Practice 5).
- Use the graph of to solve the inequality
- Solve the inequality algebraically.
- As we found in the previous Checkpoint, the point on where occurs when . The -coordinates are smaller as we move to the right on the graph, that is, for the points where .
We can also use this graphical technique to solve nonlinear equations and inequalities.
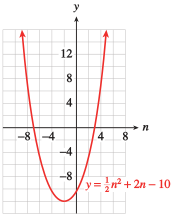
Use the graph of shown above to solve
and verify your solutions algebraically.
_____
Separate different values with a comma.
Use the graph of shown above to solve
and verify your solutions algebraically.
We look for points on the graph that have -coordinate . The -coordinates of those two points are the solutions, and . To verify the solutions we evaluate the function at and to find
When is a function called decreasing?
_____
A function is called decreasing if its -values decrease when its -values increase.
When is a function called decreasing?
- If its -values increase from left to right.
- If its -values decrease when its -values decrease.
- If its -values decrease when its -values increase.
- If the graph lies below the -axis.
Use the graph above from Practice 7 above to solve the inequality
Answer: _____
Note: Use interval notation or inequalities.
, or in interval notation,
Use the graph above from Practice 6 above to solve the inequality
In Practice 6 we found that when and . Looking at the graph, we see that points with -coordinates less than 6 make up the lower portion of the parabola. They have -coordinates between and . Thus, the solutions are , or in interval notation,
Explain how to use the graph of to solve the equation .
_____
Explain how to use the graph of to solve the equation .
Section Summary
Vocabulary
Look up the definitions of new terms in the Glossary.
- Coordinates
- Maximum
- Minimum
- Interval
- Vertical line test
- Inequality
- Algebraic solution
- Graphical solution
CONCEPTS
- The point lies on the graph of the function if and only if .
- Each point on the graph of the function has coordinates for some value of .
- The vertical line test tells us whether a graph represents a function.
- We can use a graph to solve equations and inequalities in one variable.
STUDY QUESTIONS
- How can you find the value of from a graph of ?
- If , what point lies on the graph of ?
- Explain how to construct the graph of a function from its equation.
- Explain how to use the vertical line test.
- How can you solve the equation using the graph of ?
SKILLS
Practice each skill in the Homework problems listed.
- Read function values from a graph: #1–8, 17–20, 33–36
- Recognize the graph of a function: #9–10, 31 and 32
- Construct a table of values and a graph of a function: #11–16
- Solve equations and inequalities graphically: #21–30, 41–50
Homework 1.3
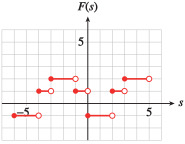
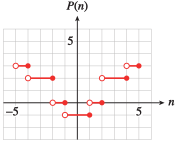
In Problems 1–8, use the graphs to answer the questions about the functions.
- Find , , and .
- For what value(s) of is ?
- Find the intercepts of the graph. List the function values given by the intercepts.
- What is the maximum value of ?
- For what value(s) of does take on its maximum value?
- On what intervals is the function increasing? Decreasing?
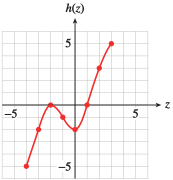
- Increasing: and ; decreasing: and
- Find , , and .
- For what value(s) of is ?
- Find the intercepts of the graph. List the function values given by the intercepts.
- What is the minimum value of ?
- For what value(s) of does take on its minimum value?
- On what intervals is the function increasing? Decreasing?
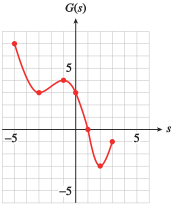
- Find and .
- For what value(s) of is ?
- Find the intercepts of the graph. List the function values given by the intercepts.
- Find the maximum and minimum values of .
- For what value(s) of does take on its maximum and minimum values?
- On what intervals is the function increasing? Decreasing?
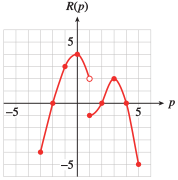
- , , ,
- Max: ; min:
- Max at ; min at
- Increasing: and ; decreasing: and
- Find and .
- For what value(s) of is ?
- Find the intercepts of the graph. List the function values given by the intercepts.
- Find the maximum and minimum values of .
- For what value(s) of does take on its maximum and minimum values?
- On what intervals is the function increasing? Decreasing?
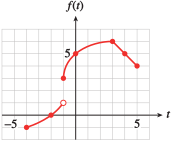
- Find , , and .
- Estimate the value of from the graph.
- For what value(s) of is ?
- Find the maximum and minimum values of .
- For what value(s) of does take on its maximum and minimum values?
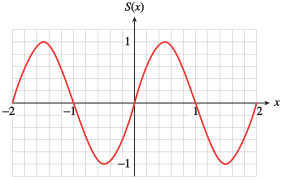
- , , ,
- Max: ; min:
- Max at ; min at
- Find , , and .
- Estimate the value of from the graph.
- For what value(s) of is ?
- Find the maximum and minimum values of .
- For what value(s) of does take on its maximum and minimum values?
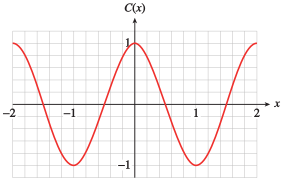
- Find , , and .
- For what value(s) of is ?
- Find the maximum and minimum values of .
- For what value(s) of does take on its maximum and minimum values?
- or
- Max: ; min:
- Max for or ; min for or
- Find , , and .
- For what value(s) of is ?
- Find the maximum and minimum values of .
- For what value(s) of does take on its maximum and minimum values?
Which of the graphs in Problems 9 and 10 represent functions?
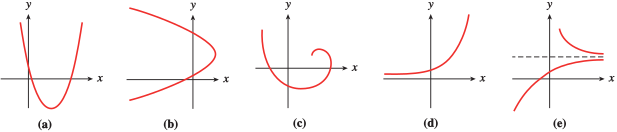
(a) and (d)
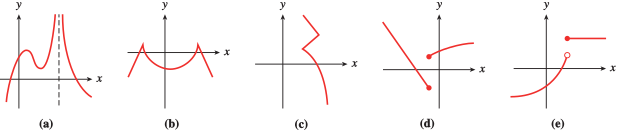
In Problems 11–16,
- Make a table of values and sketch a graph of the function by plotting points. (Use the suggested -values.)
- Use a graphing utility to graph the function.
Compare the graphing utility's graph with your sketch.
;
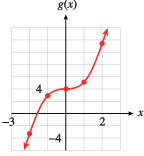
;
;
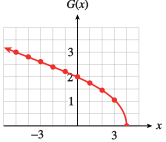
;
;
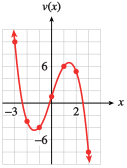
;
The graph shows the speed of sound in the ocean as a function of depth, . The speed of sound is affected both by increasing water pressure and by dropping temperature. (Source: Scientific American)
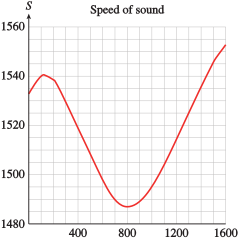
- Evaluate and explain its meaning.
- Solve and explain its meaning.
- At what depth is the speed of sound the slowest, and what is the speed? Write your answer with function notation.
- Describe the behavior of as increases.
- : The speed of sound at a depth of meters is approximately meters per second.
- or : The speed of sound is meters per second at both a depth of meters and a depth of meters.
- The slowest speed occurs at a depth of about meters and the speed is about meters per second, so .
- increases from about to in the first meters of depth, then drops to about at meters, then rises again, passing at a depth of about meters.
The graph shows the water level (meters) in Lake Superior as a function of time, . (Source: The Canadian Hydrographic Service)
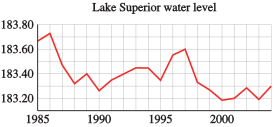
- Evaluate and explain its meaning.
- Solve and explain its meaning.
- In which two years did Lake Superior reach its highest levels, and what were those levels? Write your answers with function notation.
- Over which two-year period did the water level drop the most?
The graph shows the federal debt as a percentage of the gross domestic product (GDP), as a function of time, . (Source: Office of Management and Budget)
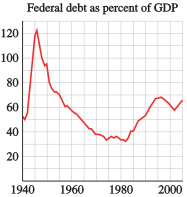
- Evaluate and explain its meaning.
- Solve and explain its meaning.
- When did the federal debt reach its highest level since 1960, and what was that level? Write your answer with function notation.
- What is the longest time interval over which the federal debt was decreasing?
- : The federal debt in was about of the gross domestic product.
- or : The federal debt was of the gross domestic product in and .
- In about , the debt was about of the gross domestic product, so .
- The percentage basically dropped from 1946 to 1973, but there were small rises around 1950, 1954, 1958, and 1968, so the longest time interval was from 1958 to 1967.
The graph shows the elevation (feet) of the 2005 Los Angeles Marathon course as a function of the distance (miles) into the race, . (Source: Los Angeles Times, March 3, 2005)
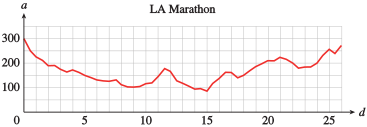
- Evaluate and explain its meaning.
- Solve and explain its meaning.
- Where does the marathon course reach its lowest elevation, and what is that elevation? Write your answer with function notation.
- Give three intervals over which the elevation is increasing.
The figure shows a graph of .
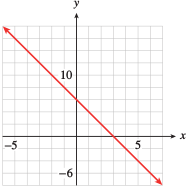
- Use the graph to find all values of for which
- Use the graph to solve
- Explain why your answers to parts (a) and (b) are the same.
- On the graph of , a value of is the same as a value of , so parts (a) and (b) are asking for the same 's.
The figure shows a graph of .
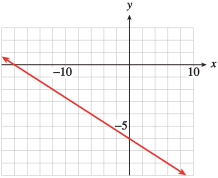
- Use the graph to find all values of for which
- Use the graph to solve
- Explain why your answers to parts (a) and (b) are the same.
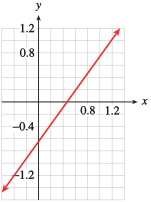
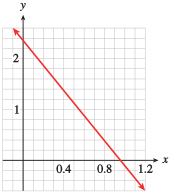
In Problems 23 and 24, use the graph to solve the equation or inequality, and then solve algebraically. (To review solving linear inequalities algebraically, see Algebra Skills Refresher.)
The figure shows the graph of . Solve the following:
The figure shows the graph of . Solve the following:
For Problems 25–30, use the graphs to estimate solutions to the equations and inequalities.
The figure shows the graph of .
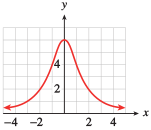
- Solve
- Solve
- or
- Approximately or
The figure shows the graph of .
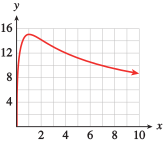
- Solve
- Solve
The figure shows a graph of .
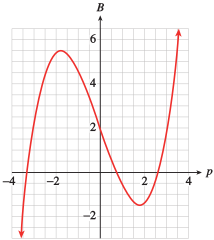
- Solve
- Solve
- Solve
- What range of values does have for between and ?
- For what values of is increasing?
- or
- or
The figure shows a graph of .
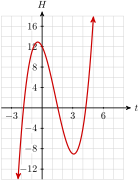
- Solve
- Solve
- Solve
- Estimate the horizontal and vertical intercepts of the graph.
- For what values of is increasing?
The figure shows a graph of .
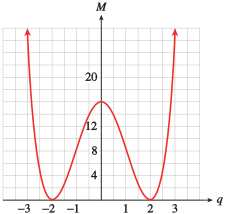
- Find all values of for which
- For what values of is increasing?
- or
- or
The figure shows a graph of .
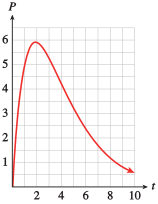
- Find all values of for which
- For what values of is decreasing?
- Delbert reads the following values from the graph of a function: Can his readings be correct? Explain why or why not.
- Francine reads the following values from the graph of a function: Can her readings be correct? Explain why or why not.
- He has an error: cannot have both the value and also the value , and cannot have both values and .
- Her readings are possible for a function: each input has only one output.
- Sketch the graph of a function that has the following values:
- Sketch the graph of a function that has the following values:
For Problems 33–36, graph each function in the friendly window
Then answer the questions about the graph. (See Using a Graphing Calculator for an explanation of friendly windows.)
- Complete the table. (Round values to tenths.)
- Find all points on the graph for which .
- Complete the table. (Round values to tenths.)
- Find all points on the graph for which .
- Estimate the coordinates of the turning points of the graph, that is, where the graph changes from increasing to decreasing or vice versa.
- Write an equation of the form for each turning point.
- ;
- Estimate the coordinates of the turning points of the graph, that is, where the graph changes from increasing to decreasing or vice versa.
- Write an equation of the form for each turning point.
For Problems 37–40, graph the function
- first using the standard window.
- then using the suggested window. Explain how the window alters the appearance of the graph in each case.
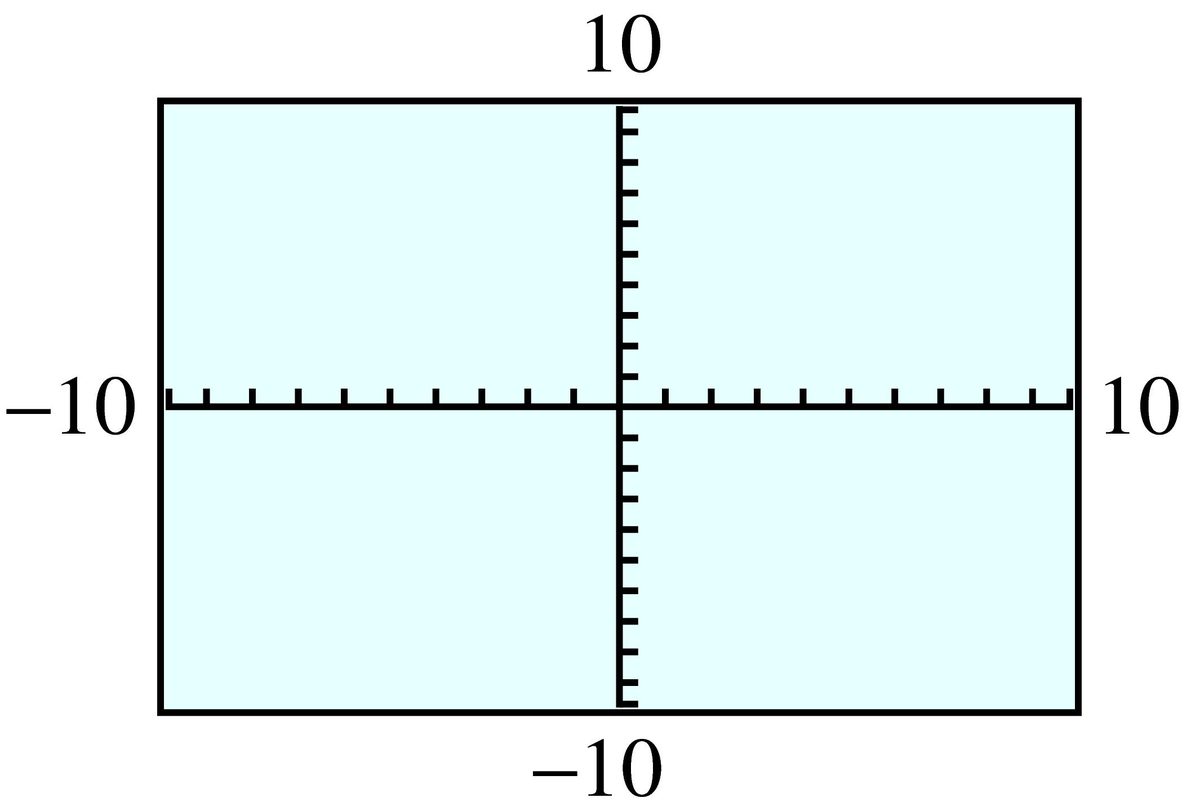
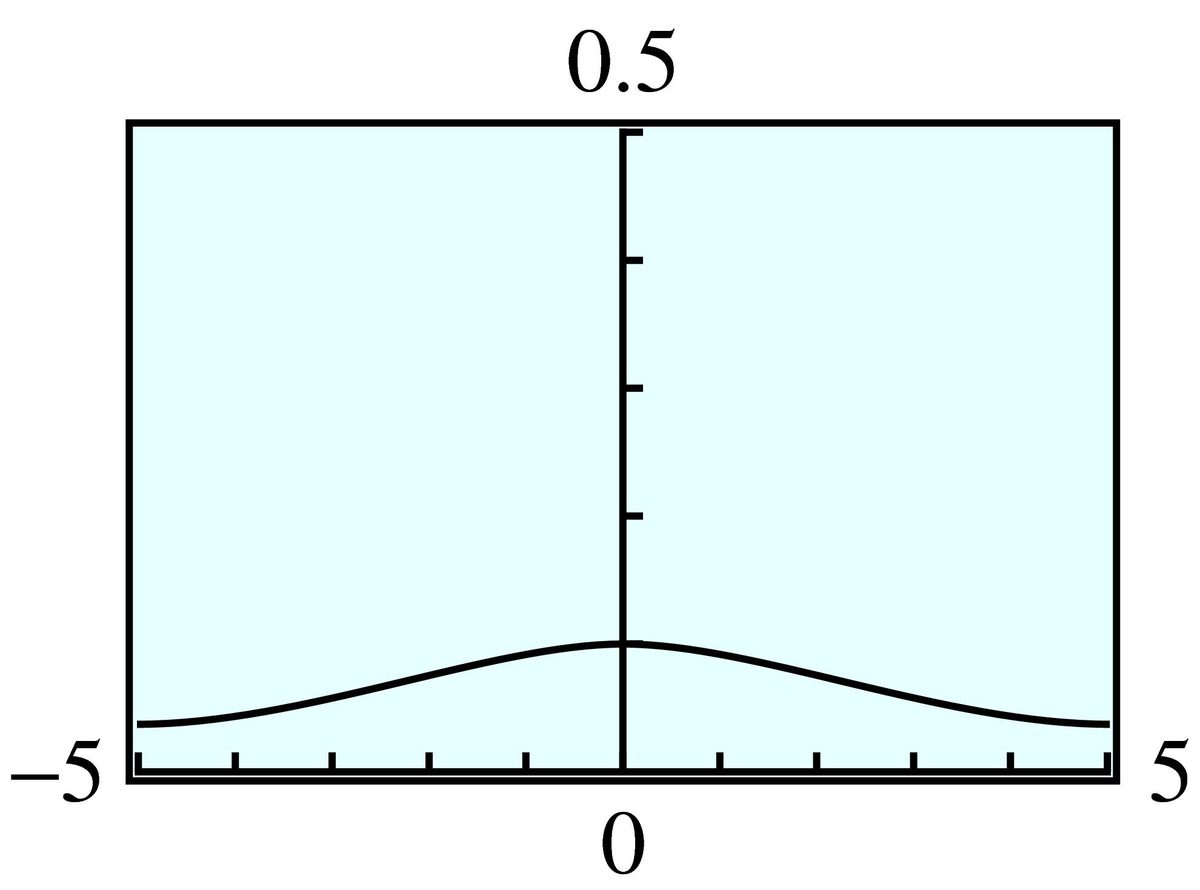
The curve cannot be distinguished from the -axis in the standard window because the values of are closer to zero than the resolution of the calculator can display. The second window provides sufficient resolution to see the curve.
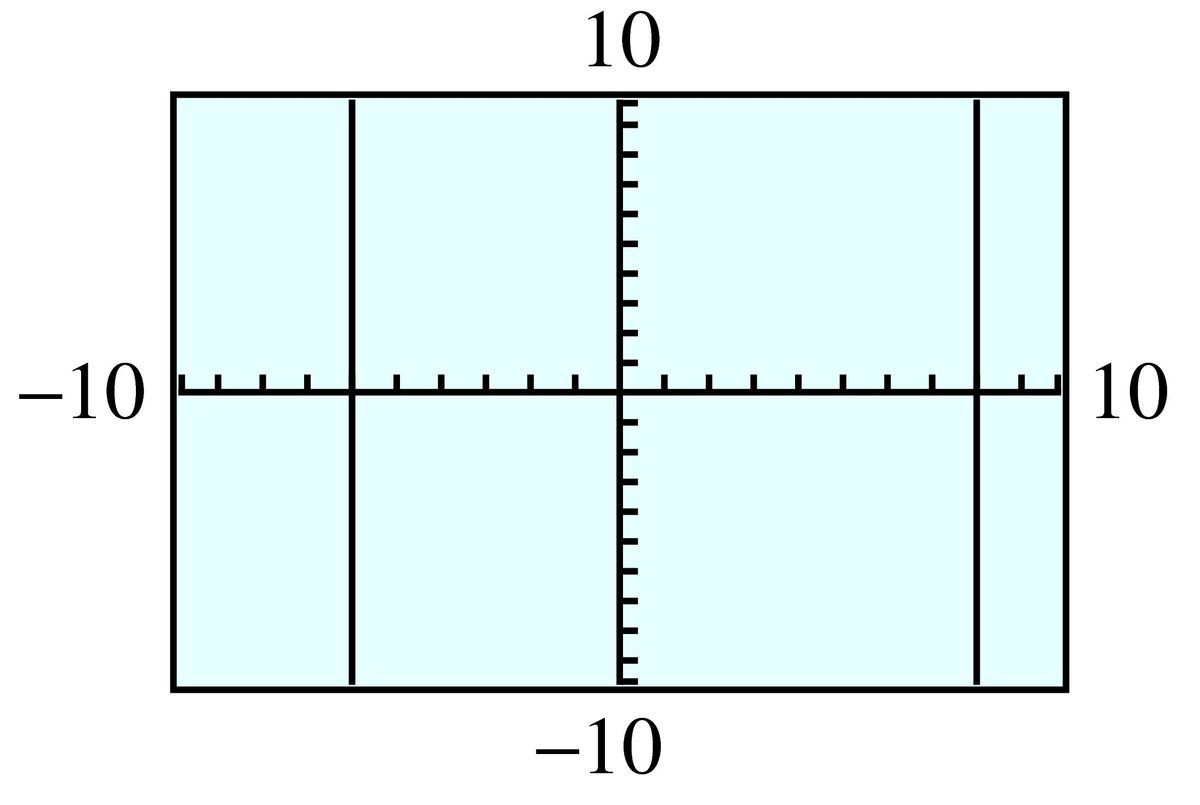
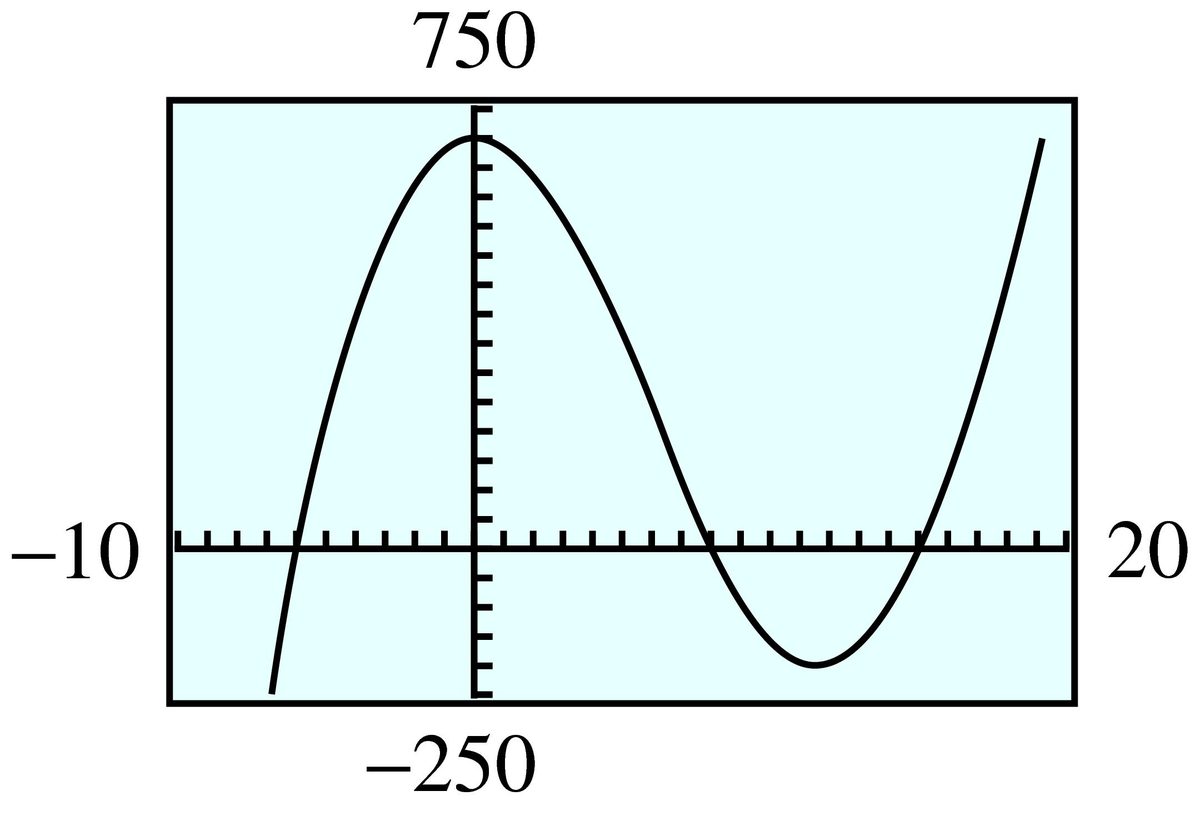
The curve looks like two vertical lines in the standard window because that window covers too small a region of the plane. The second window allows us to see the turning points of the curve.
For Problems 41–44, graph the equation with the ZInteger setting. (Press ZOOM ,then ZOOM ENTER.) Use the graph to answer each question. Use the equation to verify your answers.
Graph
- For what value of is ?
- For what value of is ?
- For what values of is ?
- For what values of is ?
Graph
- For what value of is ?
- For what value of is ?
- For what values of is ?
- For what values of is ?
Graph
- For what value of is ?
- For what value of is ?
- For what values of is ?
- For what values of is ?
Graph
- For what value of is ?
- For what value of is ?
- For what values of is ?
- For what values of is ?
For Problems 45–48, graph the equation with the ZInteger setting. Use the graph to solve each equation or inequality. Check your solutions algebraically.
Graph
- Solve
- Solve
Graph
- Solve
- Solve
Graph
- Solve
- Solve
Graph .
- Solve .
- Solve .
Graph .
- Use your graph to solve .
- Press
Y=and enter . PressGRAPH, and you should see the horizontal line superimposed on your previous graph. How many solutions does the equation have? Estimate each solution to the nearest whole number.
Graph .
- Use your graph to solve .
- Press
Y=and enter . PressGRAPH, and you should see the horizontal line superimposed on your previous graph. How many solutions does the equation have? Estimate each solution to the nearest whole number.
Modeling, Functions, and Graphs by Katherine Yoshiwara (yoshiwarabooks.org), GNU Free Documentation License 1.2 or later. Adapted for the XYZ HTML edition with the authors' permission (recorded 2026-07-04). License: GFDL-1.2-or-later.