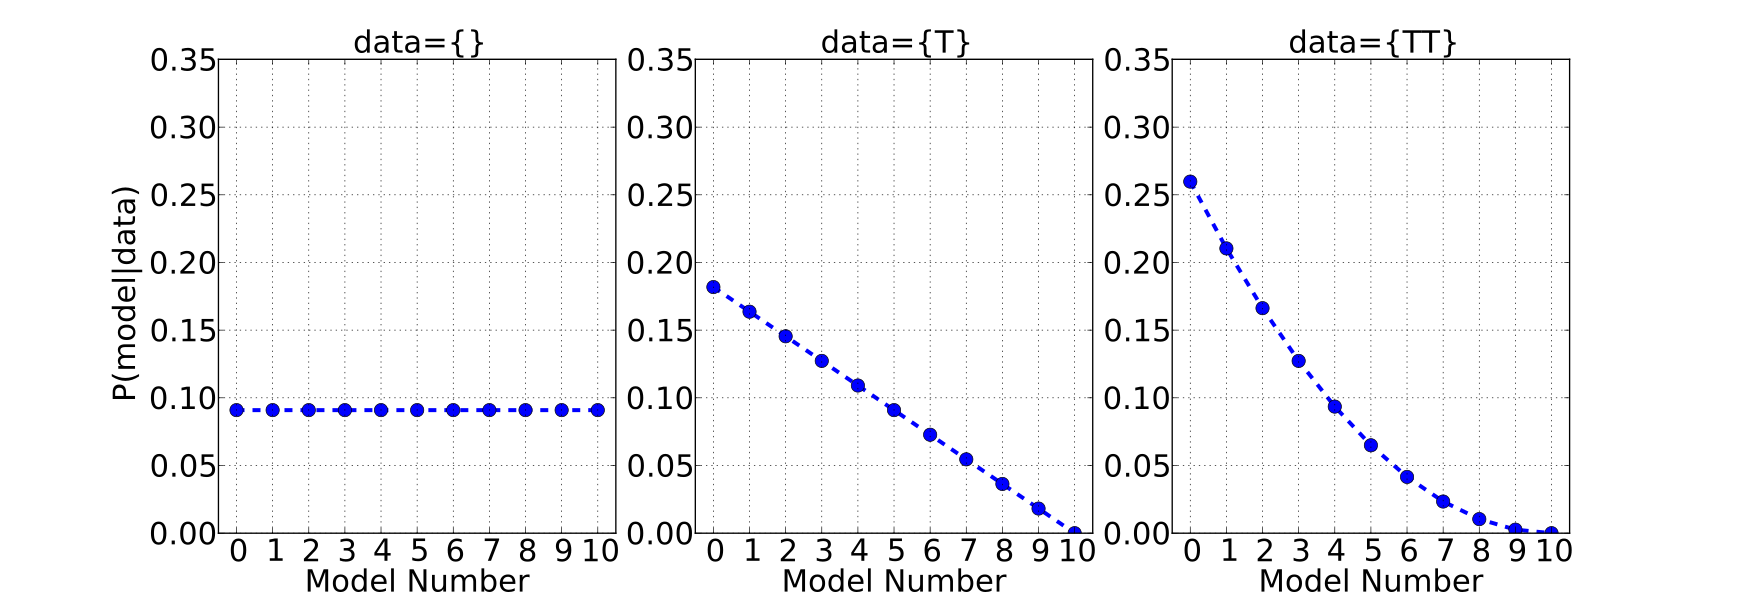
It is instructive to pause and look at this example one flip at a time, to see how the probability and thus our state of knowledge adjusts as we collect more data. In Figure 6.3 we see the result of our procedure when there is no data (i.e. our initial, prior probabilities) and when we've flipped once and then again, both times tails. The curve for “no data” is the same as the prior probability, and in this case all models are equally likely. When the first tails is observed, the model which states that heads are certain (i.e. coin 10) goes to zero probability because coin 10 cannot flip tails.. At this point we know that it is impossible for us to be flipping coin 10. We see also that the high-numbered coins (i.e. the ones with high probability of flipping heads) have greatly reduced probability while we've seen only tails.
Interactive figureA flat prior and a stubborn one, meeting the same dataDrag the Repeats of the 12-flip data set and Fair-coin prior strength sliders.
XYZ Graph · viewer build 5edf91b
Two posteriors for the same bent coin, both scaled so their peaks are 1. The solid curve uses the flat prior this chapter assumes; the dashed one starts from a prior that says the coin is probably fair, with a strength you control - k = 1 IS the flat prior, so slide k down to 1 and the two curves lie exactly on top of each other. At the printed default (one 12-flip data set, k = 20) the flat-prior peak sits at 0.25 and the fair-prior peak at 0.44: the prior has dragged the answer two thirds of the way back toward 0.5, because 40 pseudo-flips of belief outweigh 12 real ones. Now raise the repeats slider. At 4 repeats (48 flips) the dashed peak is at 0.30, at 12 repeats it is 0.28, and it never quite reaches 0.25 - but the gap shrinks like 1/n while both curves narrow. That is the trade the section's title names: a prior is not a thumb on the scale you can never lift, it is a fixed quantity of evidence that enough data will always outvote.
As more tails are observed, the probability for the lower models is increased. As we flip more tails we become more confident in the lower-number models. Because at this point we haven't flipped any heads, the model 0 still has non-zero probability - it is still possible that we are holding a coin that cannot flip heads.
Figure 6.3. Probability for different bent-coin models, given no data (left), the first tails (middle), and the second tails (right). The curve for no data is the same as the prior probability, and in this case all models are equally likely. When the first tails is observed, the model which states that heads are certain (coin 10) goes to zero probability. As more tails are observed, the probability for the lower models is increased.
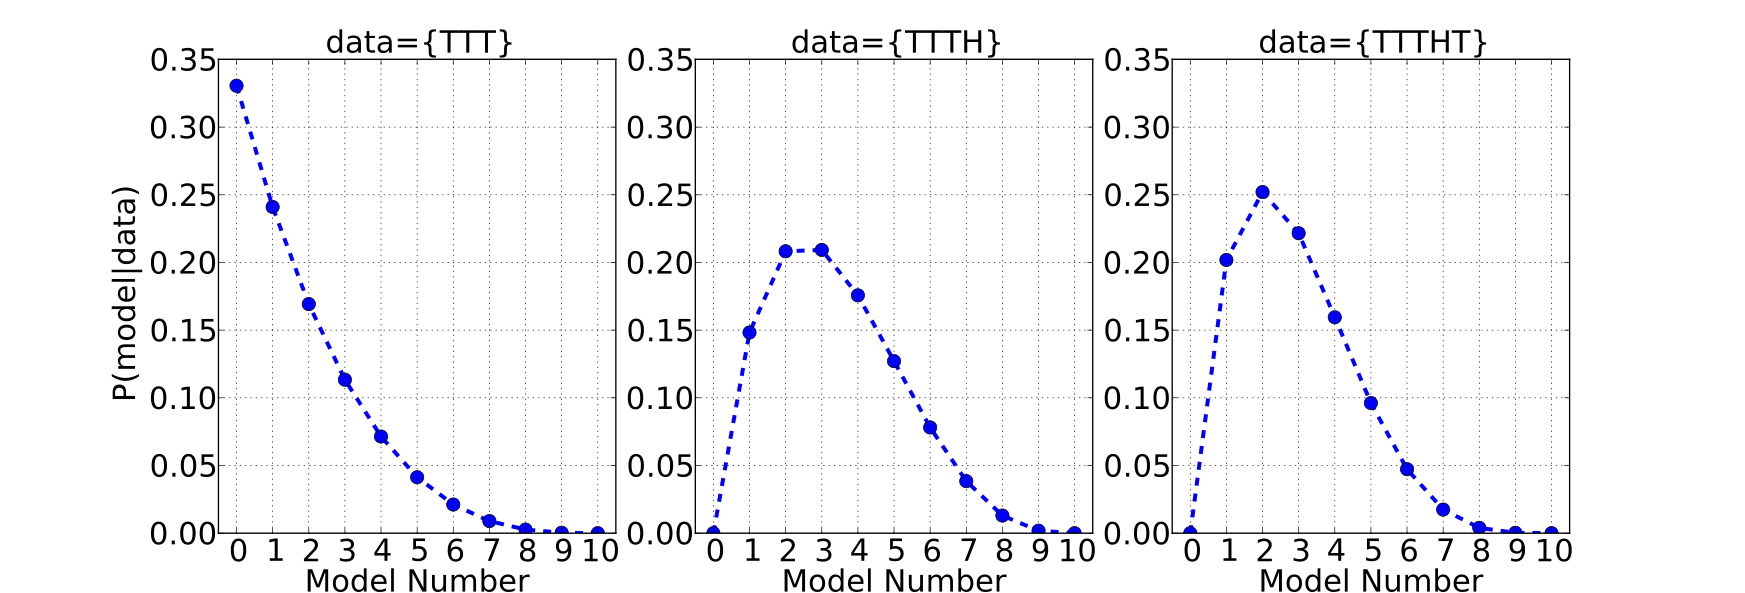
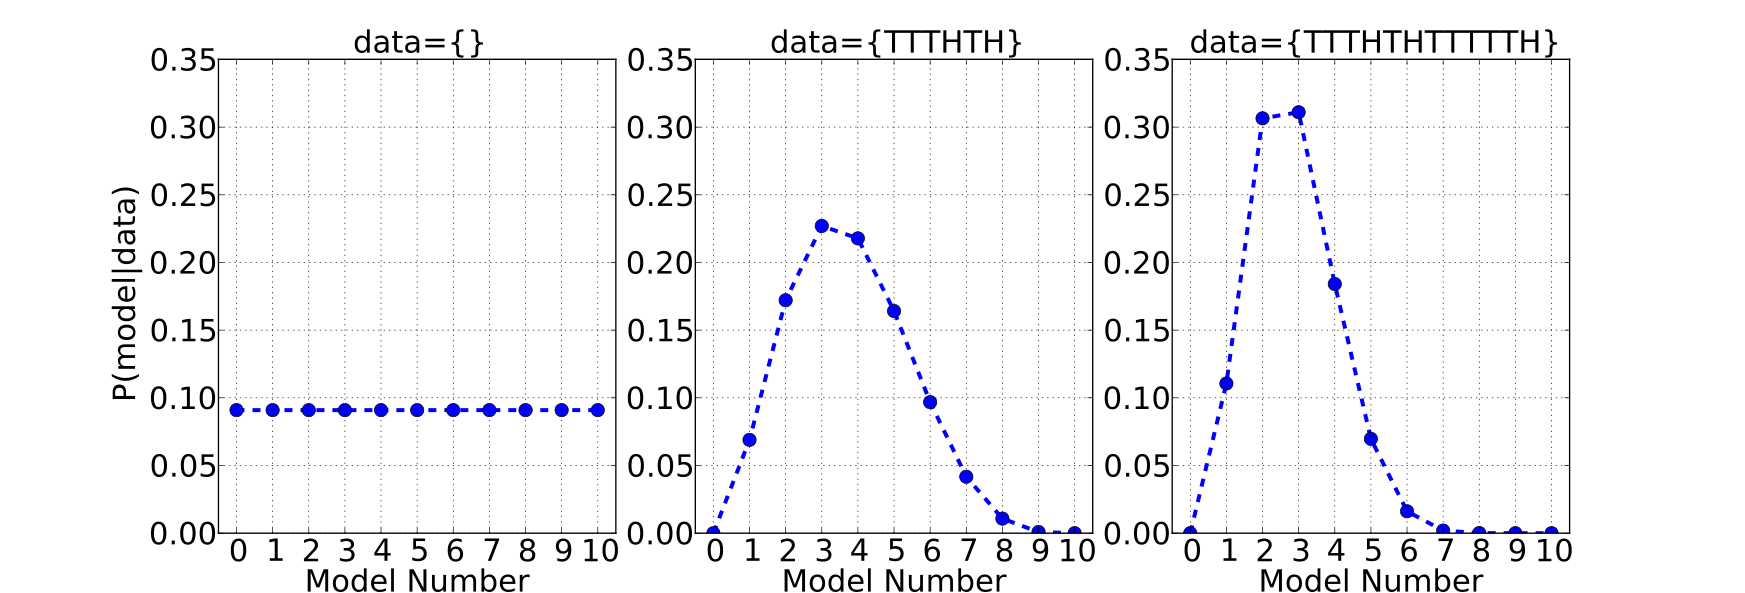
When we continue with the next few flips (Figure 6.4) we encounter our first heads on the fourth flip. At this point the model which states that heads are impossible (i.e coin 0) goes to zero probability. Finally, across our entire data set (Figure 6.5) we see that the curve gets narrower, where more of the probability falls on only a few of the models and the other models become less and less likely. With only 12 data points, there is still a lot of uncertainty in which model - several models have reasonably high probability values. We still can rule out a few models confidently (like coins 0, 6, 7, 8, 9, and 10). We are most confident in coins 2 and 3, with the most probability.
Figure 6.4. Probability for different bent-coin models, given three tails (left), the first heads (middle), and another tails (right). When the first heads is observed, the model which states that heads are impossible (coin 0) goes to zero probability.Figure 6.5. Probability for different bent-coin models, given no data (left), the first half of the data set (middle), and the entire data set of 9 tails and 3 heads (right).
Adapted from Statistical Inference for Everyone, by Brian Blais (Bryant University), licensed under CC BY-SA 4.0 (dual-licensed under the GNU FDL 1.2 or later; this adaptation uses the CC BY-SA grant). Changes were made; this adaptation is distributed under the same license. License: CC-BY-SA-4.0.
These eBooks are a prerelease and are not yet certified conformant with WCAG 2.1 AA or ADA Title II. Every page is built against an automated accessibility gate, and the published editions will meet ADA Title II requirements when they release in late September 2026. If something is unusable, please tell us.

![Function graph showing y = (x^(3*n)*(1-x)^(9*n))/(0.25^(3*n)*0.75^(9*n)) on x in [0, 1] with the region between the curve and the x-axis shaded and y = (x^(3*n+k-1)*(1-x)^(9*n+k-1))/(((3*n+k-1)/(12*n+2*k-2))^(3*n+k-1)*(1-((3*n+k-1)/(12*n+2*k-2)))^(9*n+k-1)) on x in [0, 1]. Adjustable parameters: Repeats of the 12-flip data set (n) = 1, Fair-coin prior strength (k) = 20. Viewing window: x from -0.07 to 1.13, y from -0.13 to 1.07.](figures/xg-blais-ch06-priors-versus-data.svg)