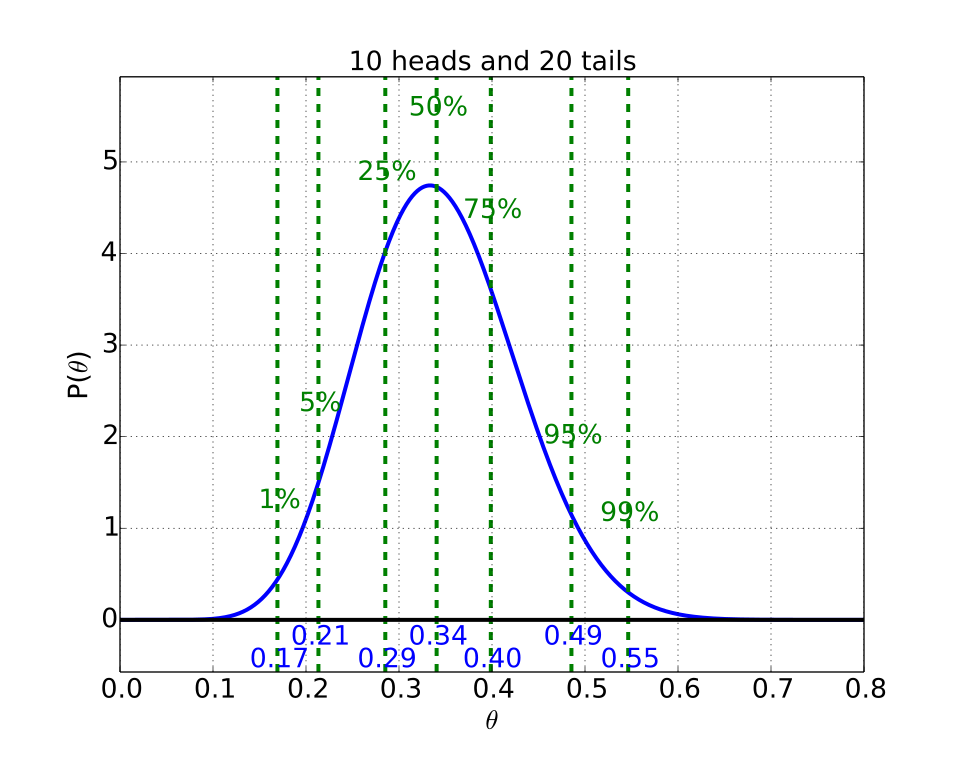
Figure 6.10. Posterior probability distribution for the values of the bent coin - the probability that the coin will land heads. The distribution is shown for data 10 heads and 20 tails. The various quartiles are shown in the plot, and summarized in the accompanying table.
Beta( heads=10, tails=20)
Value
Area
0.17
0.01
0.21
0.05
0.24
0.10
0.29
0.25
0.34
0.50
0.40
0.75
0.45
0.90
0.49
0.95
0.55
0.99
Adapted from Statistical Inference for Everyone, by Brian Blais (Bryant University), licensed under CC BY-SA 4.0 (dual-licensed under the GNU FDL 1.2 or later; this adaptation uses the CC BY-SA grant). Changes were made; this adaptation is distributed under the same license. License: CC-BY-SA-4.0.
These eBooks are a prerelease and are not yet certified conformant with WCAG 2.1 AA or ADA Title II. Every page is built against an automated accessibility gate, and the published editions will meet ADA Title II requirements when they release in late September 2026. If something is unusable, please tell us.