
6.2 Bent Coins
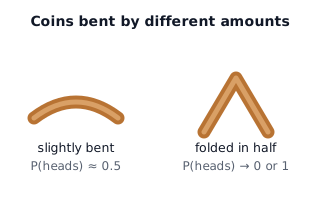
Imagine we have a series of coins bent by various amounts (Figure 6.1). If the coin is bent completely in half, then we could have the coin always flip heads (i.e. ) or tails (i.e. ) depending on how it is bent. If you don't bend the coin at all then we'd have a fair coin (). So, let's say that we have a collection of bent coins which are bent by different amounts. For convenience we will number them from 0 to 10. The Table 6.1 summarizes the probability of each coin flipping heads.
| Coin Number | Probability for Flipping Heads () |
|---|---|
| 0 | 0.0 |
| 1 | 0.1 |
| 2 | 0.2 |
| 3 | 0.3 |
| 4 | 0.4 |
| 5 | 0.5 |
| 6 | 0.6 |
| 7 | 0.7 |
| 8 | 0.8 |
| 9 | 0.9 |
| 10 | 1.0 |
Now I have the following scenario1, with a few questions.
The way we've set up this problem is exactly like the model comparison example with the High and Low Deck (Section 4.2), except in this case we have 11 models (one for each coin). Applying the Bayes' Recipe we have
- Specify the prior probabilities for the models being considered. Given no further information, we select a uniform distribution for the prior (i.e. all models are initially equally probable):
where is the model defined by “we're flipping coin 0,” is the model defined by “we're flipping coin 1,” etc...
- Write the top of Bayes' Rule for all models being considered:
- Put in the likelihood and prior values. Here we are drawing from a binomial distribution for the likelihood:
- Add these values for all models: see Table 6.2.
- Divide each of the values by this sum, , to get the final probabilities: see Table 6.2.
| Model | ||
|---|---|---|
| 0.000 | 0.000 | |
| 0.00774 | 0.110 | |
| 0.0214 | 0.306 | |
| 0.0217 | 0.310 | |
| 0.0128 | 0.184 | |
| 0.00488 | 0.0696 | |
| 0.00113 | 0.0161 | |
| 0.000135 | 0.00192 | |
| 0.00000524 | 0.0000748 | |
| 0.0000000145 | 0.000000208 | |
| 0.000 | 0.000 | |
| =0.0700 |
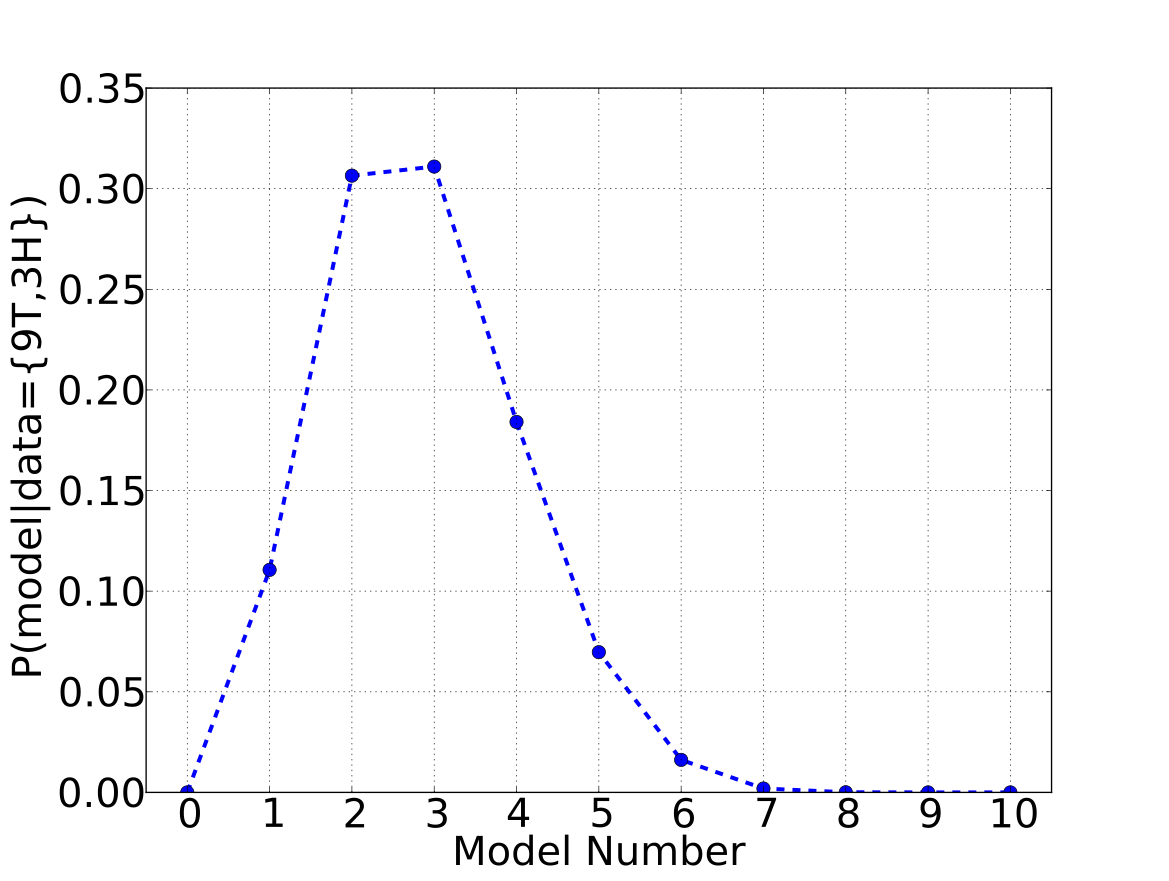
When we are dealing with this many models, it is easier to plot the results, shown in Figure 6.2. We are now in a position to address the questions posed at the beginning of the section.
- From this data, which coin do I most likely have?
The maximum probability is for coin 3, but coin 2 is a close second. Thus we can be reasonably confident that we have been flipping one of those two coins, but can't narrow our confidence any more than that.
- Can we be significantly confident that this particular coin will result in more tails than heads in the future?
This is another way of asking for the total probability for coins less than coin 5 (the fair coin), or
which says that this coin is “likely” to “very likely” (Table 1.1 on page 51) to have a probability of yielding heads less than a fair coin, and thus yield more tails in the future.
Adapted from Statistical Inference for Everyone, by Brian Blais (Bryant University), licensed under CC BY-SA 4.0 (dual-licensed under the GNU FDL 1.2 or later; this adaptation uses the CC BY-SA grant). Changes were made; this adaptation is distributed under the same license. License: CC-BY-SA-4.0.