To test to see if the slope is significant we will be doing a two-tailed test with hypotheses. The population least squares regression line would be where (pronounced “beta-naught”) is the population -intercept, (pronounced “beta-one”) is the population slope and is called the error term.
If the slope were horizontal (equal to zero), the regression line would give the same -value for every input of and would be of no use. If there is a statistically significant linear relationship then the slope needs to be different from zero. We will only do the two-tailed test, but the same rules for hypothesis testing apply for a one-tailed test.
We will only be using the two-tailed test for a population slope.
The hypotheses are:
The null hypothesis of a two-tailed test states that there is not a linear relationship between and . The alternative hypothesis of a two-tailed test states that there is a significant linear relationship between and .
Either a t-test or an F-test may be used to see if the slope is significantly different from zero. The population of the variable must be normally distributed.
F-Test for Regression
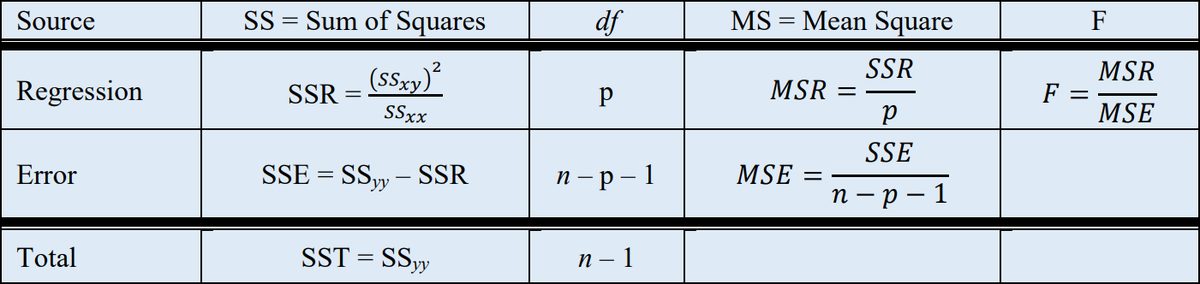
An F-test can be used instead of a t-test. Both tests will yield the same results, so it is a matter of preference and what technology is available. Figure 12-12 is a template for a regression ANOVA table,
Figure 12-12: Regression ANOVA table template.
where is the number of pairs in the sample and is the number of predictor (independent) variables; for now this is just . Use the F-distribution with degrees of freedom for regression = , and degrees of freedom for error = . This F-test is always a right-tailed test since ANOVA is testing the variation in the regression model is larger than the variation in the error.
T-Test for Regression
If the regression equation has a slope of zero, then every value will give the same value and the regression equation would be useless for prediction. We should perform a t-test to see if the slope is significantly different from zero before using the regression equation for prediction. The numeric value of t will be the same as the t-test for a correlation. The two test statistic formulas are algebraically equal; however, the formulas are different and we use a different parameter in the hypotheses.
The formula for the t-test statistic is
Use the t-distribution with degrees of freedom equal to .
The t-test for slope has the same hypotheses as the F-test:
These eBooks are a prerelease and are not yet certified conformant with WCAG 2.1 AA or ADA Title II. Every page is built against an automated accessibility gate, and the published editions will meet ADA Title II requirements when they release in late September 2026. If something is unusable, please tell us.