
Login
📚 Mostly Harmless Statistics
Chapters ▾

4 Probability

4.01: Introduction

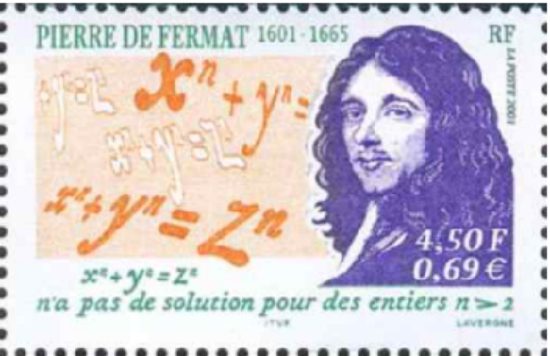
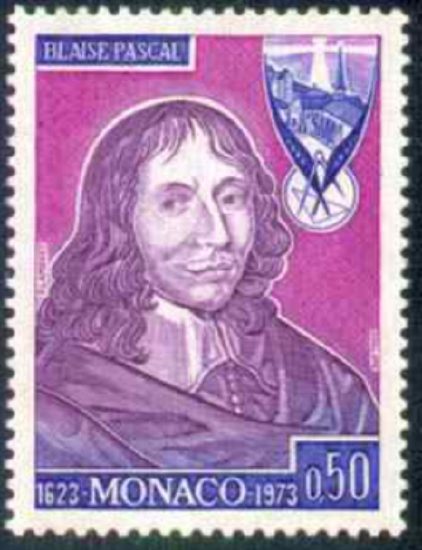
One story about how probability theory was developed is that a gambler wanted to know when to bet more and when to bet less. He talked to a couple of friends of his that happened to be mathematicians. Their names were Pierre de Fermat and Blaise Pascal. Since then many other mathematicians have worked to develop probability theory.
clipboard_e6d6aed6e83e925553ed47c461b603fc2.png
clipboard_e977f9133b031b0d3f2e526bc5dad37ce.png
Figure \(\PageIndex{1}\): Fermat and Pascal

Understanding probability is important in life. Examples of mundane questions that probability can answer for you are: do I need to carry an umbrella? Do you wear a heavy coat on a given day? More important questions that probability can help with are your chances that the car you are buying will need more maintenance, your chances of passing a class, your chances of winning the lottery, or your chances of catching a deadly virus. The chance of you winning the lottery is very small, yet many people will spend the money on lottery tickets. In general, events that have a low probability (under 5%) are unlikely to occur. Whereas if an event has a high probability of happening (over 80%), then there is a good chance that the event will happen. This chapter will present some of the theory that you need to help decide if an event is likely to happen or not.

First, some definitions:

Definition: Experiment

An activity or process that has specific results that can be repeated indefinitely which has a set of well-defined outcomes.

Definition: Outcomes

The results of an experiment.

Definition: Sample Space

Collection of all possible outcomes of the experiment. Usually denoted as S.

Definition: Event

The set of outcomes that are a subset of the sample space. The symbol used for events is usually a capital letter often at the beginning of the alphabet like A, B or C.

Here are some examples of sample spaces and events.

Figure 4-1
Experiment Sample Space Example of Event
Toss a coin twice {HH, HT, TH, TT} A = Getting exactly two heads = {HH}
Toss a coin twice {HH, HT, TH, TT} B = Getting at least one head = {HH, HT, TH}
Roll a die {1, 2, 3, 4, 5, 6} C = Roll an odd number = {1, 3, 5}
Roll a die {1, 2, 3, 4, 5, 6} D = Roll a prime number = {2, 3, 5}
Roll a die {1, 2, 3, 4, 5, 6} E = Roll an even number = {2, 4, 6}

A tree diagram is a graphical way of representing a random experiment with multiple steps

A bag contains 10 colored marbles: 7 red and 3 blue. A random experiment consists of drawing a marble from the bag, then drawing another marble without replacement (without putting the first marble back in the bag). Create the tree diagram for this experiment and write out the sample space.

Solution

The first marble that is drawn can be either red or blue and is represented with the first sideway V split. The next marble that is drawn is represented by the two sideway V splits on the right. The top sideways V assumes that a red marble was drawn on the first draw, and then the second marble drawn can be either red or blue. The bottom sideway V assumes that a blue marble was drawn on the first draw, and then the second marble drawn can be either red or blue. Then combine the colors as you trace up the four pathways from left to right.

clipboard_e874d904b21fa75d297418d46d020f6e0.png

Figure 4-2

The sample space would be S = {RR, RB, BR, BB}. Note that the event RB and BR are considered different outcomes since they are picked in a different order and are considered distinct events.

4.02: Three Types of Probability

Classical Approach to Probability (Theoretical Probability)

\[P(A) = \dfrac{\text{Number of ways A can occur}}{\text{Number of different outcomes in S}}\]

The classical approach can only be used if each outcome has equal probability.

If an experiment consists of flipping a coin twice, compute the probability of getting exactly two heads.

Solution

The event of getting exactly two heads is A = {HH}. The number of ways A can occur is 1. The number of different outcomes in S = {HH, HT, TH, TT} is 4. Thus P(A) = ¼.

If a random experiment consists of rolling a six-sided die, compute the probability of rolling a 4.

Solution

The sample space is S = {1, 2, 3, 4, 5, 6}. The event A is that you want is to get a 4, and the event space is A = {4}. Thus, in theory the probability of rolling a 4 would be P(A) = 1/6 = 0.1667.

Suppose you have an iPhone with the following songs on it: 5 Rolling Stones songs, 7 Beatles songs, 9 Bob Dylan songs, 4 Johnny Cash songs, 2 Carrie Underwood songs, 7 U2 songs, 4 Mariah Carey songs, 7 Bob Marley songs, 6 Bunny Wailer songs, 7 Elton John songs, 5 Led Zeppelin songs, and 4 Dave Matthews Band songs. The different genre that you have are rock from the ‘60s which includes Rolling Stones, Beatles, and Bob Dylan; country includes Johnny Cash and Carrie Underwood; rock of the ‘90s includes U2 and Mariah Carey; Reggae includes Bob Marley and Bunny Wailer; rock of the ‘70s includes Elton John and Led Zeppelin; and bluegrass/rock includes Dave Matthews Band.

  1. What is the probability that you will hear a Johnny Cash song?
  2. What is the probability that you will hear a Bunny Wailer song?
  3. What is the probability that you will hear a song from the ‘60s?
  4. What is the probability that you will hear a Reggae song?
  5. What is the probability that you will hear a song from the ‘90s or a bluegrass/rock song?
  6. What is the probability that you will hear an Elton John or a Carrie Underwood song?
  7. What is the probability that you will hear a country song or a U2 song?
  8. Solution

    a) The way an iPhone works, it randomly picks the next song so you have no idea what the next song will be. Now you would like to calculate the probability that you will hear the type of music or the artist that you are interested in. The sample set is too difficult to write out, but you can figure it from looking at the number in each set and the total number. The total number of songs you have is 67. There are 4 Johnny Cash songs out of the 67 songs. P(Johnny Cash song) = 4/67 = 0.0597

    b) There are 6 Bunny Wailer songs. P(Bunny Wailer) = 6/67 = 0.0896.

    c) There are 5, 7, and 9 songs that are classified as rock from the ‘60s, which is a total of 21. P(rock from the ‘60s) = 21/67 = 0.3134.

    d) There are total of 13 songs that are classified as Reggae. P(Reggae) = 13/67 = 0.1940

    e) There are 7 and 4 songs that are songs from the ‘90s and 4 songs that are bluegrass/rock, for a total of 15. P(rock from the ‘90s or bluegrass/rock) = 15/67 = 0.2239.

    f) There are 7 Elton John songs and 2 Carrie Underwood songs, for a total of 9. P(Elton John or Carrie Underwood song) = 9/67 = 0.1343.

    g) There are 6 country songs and 7 U2 songs, for a total of 13. P(country or U2 song) = 13/67 = 0.1940.

Empirical Probability (Experimental or Relative Frequency Probability)

The experiment is performed many times and the number of times that event A occurs is recorded. Then the probability is approximated by finding the relative frequency.

\[P(A) = \dfrac{\text{Number of ways A occurred}}{\text{Number of times the experiment was repeated}}\]

Important: The probability of any event A satisfies 0 ≤ P(A) ≤ 1, keep this in mind if the question is asking for a probability, and make sure your answer is a number between 0 and 1. A probability, relative frequency, percentage, and proportion are all different words for the same concept. Probability answers can be given as percentages, decimals, or reduced fractions.

Suppose that the experiment is rolling a die. Compute the probability of rolling a 4.

Solution

The sample space is S = {1, 2, 3, 4, 5, 6}. The event A is that you want is to get a 4, and the event space is A = {4}. To do this, roll a die 10 times. When you do that, you get 4 two times. Based on this experiment, the probability of getting a 4 is 2 out of 10 or 1/5 = 0.2. To get more accuracy, repeat the experiment more times. It is easiest to put this information in a table, where n represents the number of times the experiment is repeated. When you put the number of 4s found divisible by the number of times you repeat the experiment, this is the relative frequency. See the last column in Figure 4-3.

Figure 4-3: Trials for Die Experiment n Number of 4s Relative Frequency 10 2 0.2 50 6 0.12 100 18 0.18 500 81 0.162 1,000 163 0.163

Notice that as n increased, the relative frequency seems to approach a number; it looks like it is approaching 0.163. You can say that the probability of getting a 4 is approximately 0.163. If you want more accuracy, then increase n even more by rolling the die more times.

These probabilities are called experimental probabilities since they are found by actually doing the experiment or simulation. They come about from the relative frequencies and give an approximation of the true probability.

The approximate probability of an event \(A\), notated as \(P(A)\), is

\[P(A) = \frac{\text{Number of ways A occurred}}{\text{Number of times the experiment was repeated}}\]

For the event of getting a 4, the probability would be P(Roll a 4) = \(\frac{\text{Number of times A occurred}}{\text{Number of times the experiment was repeated}}\) = 0.163

“‘What was that voice?’ shouted Arthur.

‘I don't know,’ yelled Ford, ‘I don't know. It sounded like a measurement of probability.’

‘Probability? What do you mean?’

‘Probability. You know, like two to one, three to one, five to four against. It said two to the power of one hundred thousand to one against. That's pretty improbable you know.’”

(Adams, 2002)

Law of Large Numbers: as n increases, the relative frequency tends towards the theoretical probability

Figure 4-4 shows a graph of experimental probabilities as n gets larger and larger. The dashed yellow line is the theoretical probability of rolling a four of 1/6 \(\neq\) 0.1667. Note the x-axis is in a log scale.

Note that the more times you roll the die, the closer the experimental probability gets to the theoretical probability.

clipboard_e0d50b53c9375b02c4ac9b9e978642ae8.png

Figure 4-4

You can compute experimental probabilities whenever it is not possible to calculate probabilities using other means. An example is if you want to find the probability that a family has 5 children, you would have to actually look at many families, and count how many have 5 children. Then you could calculate the probability. Another example is if you want to figure out if a die is fair. You would have to roll the die many times and count how often each side comes up. Make sure you repeat an experiment many times, because otherwise you will not be able to estimate the true probability of 5 children. This is due to the law of large numbers, since the more times we repeat the experiment, the closer the experimental probabilities will get to the theoretical probabilities. For difficult theoretical probabilities, we can run computer simulations that can run an experiment repeatedly many times very quickly and come up with accurate estimates of the theoretical probability.

A fitness center coach kept track of members over the last year. They recorded if the person stretched before they exercised, and whether they sustained an injury. The following contingency table shows their results. Select one member at random and find the following probabilities.

InjuryNo InjuryStretched 52 270 Did Not Stretch 21 57
  1. Compute the probability that a member sustained an injury.
  2. Compute the probability that a member did not stretch.
  3. Compute the probability that a member sustained an injury and did not stretch.
Solution

a) Find the totals for each row, column, and grand total.

Injury No Injury Total
Stretched 52 270 322
Did Not Stretch 21 57 78
Total 73 327 400

Next, find the relative frequencies by dividing each number by the total of 400.

Injury No Injury Total
Stretched 0.13 0.675 0.805
Did Not Stretch 0.0525 0.1425 0.195
Total 0.1825 0.8175 1

Using the definition of a probability we get P(Injury) = \(\frac{\text{Number of injuries}}{\text{Total number of people}}\) = \(\frac{73}{400}\) = 0.1825.

  Injury No Injury Total
Stretched 0.13 0.675 0.805
Did Not Stretch 0.0525 0.1425 0.195
Total 0.1825 0.8175 1

Using the table, we can get the same answer very quickly by just taking the column total under Injury to get 0.1825. As we get more complicated probability questions, these contingency tables will help organize your data.

b) Using the relative frequency contingency table, take the total of the row for all the members that did not stretch and we get the P(Did Not Stretch) = 0.195.

Injury No Injury Total
Stretched 0.13 0.675 0.805
Did Not Stretch 0.0525 0.1425 0.195
Total 0.1825 0.8175 1

c) Using the relative frequency contingency table, take the intersection of the injury column with the did not stretch row and we get P(Injury and Did Not Stretch) = 0.0525.

Injury No Injury Total
Stretched 0.13 0.675 0.805
Did Not Stretch 0.0525 0.1425 0.195
Total 0.1825 0.8175 1

3. Subjective Probability

The probability of event A is estimated using previous knowledge and is someone’s opinion.

Compute the probability of meeting Dolly Parton.

Solution

I estimate the probability of meeting Dolly Parton to be 1.2E-9 \(\neg\) 0.0000000012 (i.e. very, very small).

What is the probability it will rain tomorrow?

Solution

A weather reporter looks at several forecasts, uses their expert knowledge of the region, and reports the probability that it will rain in Portland, OR, is 80%.

clipboard_e85cd930f0a917ed5a790c0ba29538cff.png

4.03: Complement Rule

AA random sample of 500 records from the 2010 United States Census were downloaded to Excel and the following contingency table was found for biological sex and marital status. Select one member at random and find the following probabilities.

Count of Marital StatusColumn Labels   Row LabelsFemaleMaleGrand Total Divorced 21 17 38 Married/spouse absent 5 9 14 Married/spouse absent 92 100 192 Never married/single 93 129 222 Separated 1 2 3 Widowed 20 11 31 Grand Total232268500

a) Compute the probability that a person is divorced.

b) Compute the probability that a person is not divorced.

Solution

a) Take the row total of all divorced which is 38 and then divide by the grand total of 500 to get P(Divorced) = 38/500 = 0.076.

b) We can add up all the other category totals besides divorced 14 + 192 + 222 + 3 + 31 = 462, then divide by the grand total to get P(Not Divorced) = 462/500 = 0.924.

There is a faster way to computer these probabilities that will be important for more complicated probabilities called the complement rule. The table contains 100% (100% = 1 as a proportion) of our data so we can assume that the probability of the divorced is the opposite (complement) to the probability of not being divorced.

Notice that the P(Divorced) + P(Not Divorced) = 1. This is because these two events have no outcomes in common, and together they make up the entire sample space. Events that have this property are called complementary events. Notice P(Not Divorced) = 1 – P(Divorced) = 1 – 0.076 = 0.924.

If two events are complementary events, then to find the probability of one event just subtract the probability from 1. Notation used for complement of A also called “not A” is AC.

P(A) + P(AC) = 1 or P(A) = 1 – P(AC) or P(AC) = 1 – P(A)

Some texts will use the notation for a complement as A' or \(\overline{ A }\), instead of AC.

Suppose you know that the probability of it raining today is 80%. What is the probability of it not raining today?

clipboard_e26dbb3807b99dfa735ddaf4a4f1883d7.png

Solution

Since not raining is the complement of raining, then P(not raining) = 1 – P(raining) = 1 – 0.8 = 0.2.

“On a small obscure world somewhere in the middle of nowhere in particular - nowhere, that is, that could ever be found, since it is protected by a vast field of unprobability to which only six men in this galaxy have a key - it was raining.” (Adams, 2002)

Venn Diagrams

Figure 4-5 is an example of a Venn diagram and is a visual way to represent sets and probability. The rectangle represents all the possible outcomes in the entire sample space (the population). The shapes inside the rectangle represent each event in the sample space. Usually these are ovals, but they can be any shape you want. If there are any shared elements between the events then the circles should overlap one another.

clipboard_e7e00c96376447f039c06c5851c397369.png

Figure 4-5

The field of statistics includes machine learning, data analysis, and data science. The field of computer science includes machine learning, data science and web development. The field of business and domain expertise includes data analysis, data science and web development. If you know machine learning, then you will need a background in both statistics and computer science. If you are a data scientist, then you will need a background in statistics, computer science, business and domain expertise.

Suppose you know the probability of not getting the flu is 0.24. Draw a Venn diagram and find the probability of getting the flu.

Solution

Since getting the flu is the complement of not getting the flu, the P(getting the flu) = 1 – P(not getting the flu) = 1 – 0.24 = 0.76.

Label each space as in Figure 4-6.

clipboard_ef684a2e2e1f808dcd3f8c6f1354f62d5.png

Figure 4-6

The complement is useful when you are trying to find the probability of an event that involves the words “at least” or an event that involves the words “at most.” As an example of an “at least” event is supposing you want to find the probability of making at least $50,000 when you graduate from college. That means you want the probability of your salary being greater than or equal to $50,000.

An example of an “at most” event is supposing you want to find the probability of rolling a die and getting at most a 4. That means that you want to get less than or equal to a 4 on the die, a 1, 2, 3, or 4.

The reason to use the complement is that sometimes it is easier to find the probability of the complement and then subtract from 1.

4.04: Union and Intersection

When two events cannot happen at the same time, they are called mutually exclusive or disjoint events.

clipboard_e306982b33cc40bebc698ed3749d8874c.png

Figure 4-7

clipboard_e26529b67451957588156906561119260.png

Figure 4-8

clipboard_e8c91af256592477c69ba2234318477d9.png

Figure 4-9

clipboard_eb02a8fd21a72cf90f0d75379d61f67ac.png

Figure 4-10

For example, a student cannot be a freshman and a sophomore at the same time, see Figure 4-9. These are mutually exclusive events. A student could be freshman and a business major at the same time so the event freshman and the event business major are not mutually exclusive see Figure 4-10.

Intersection

When we are finding the probability of both A and B happening at the same time we denote this as P(A ∩ B). This overlap is called the intersection.

When two events, say A and B, occur at the same time, this is denoted as the intersection of A and B and is denoted as (A ∩ B). Think of the symbol ∩ as an A in “and.”

If two events are mutually exclusive then A ∩ B = { } the empty set (also denoted as \(\varnothing\)) and the P(A ∩ B) = 0.

Union

When either event A, event B, or both occur then we call this the union of A or B, which is denoted as (A U B). When finding the probability of A or B we denote this as P(A U B). When we write “or” in statistics, we mean “and/or” unless we explicitly state otherwise. Thus, A or B occurs means A, B, or both A and B occur.

Figure 4-11 is a Venn diagram for the union rule.

clipboard_e7066678fb55d622323a569a8e2475995.png

Figure 4-11

The Union Rule: P(A U B) = P(A) + P(B) – P(A ∩ B).

If two events are mutually exclusive, then the probability of them occurring at the same time is P(A ∩ B) = 0. So, if A and B are mutually exclusive then the P(A U B) = P(A) + P(B) as shown in Figure 4-7. It is best to write out the rule with the intersection so that you do not forget to subtract any overlapping intersection.

The family college data set contains a sample of 792 cases with two variables, teen and parents. The teen variable is either college or not, where the college label means the teen went to college immediately after high school. The parent’s variable takes the value degree if at least one parent of the teenager completed a college degree. Make a Venn Diagram for the data.

Example from OpenIntroStatistics.

clipboard_ecb618199c79802d60baca7fc78e9e602.png

Solution

Find the relative frequencies.

clipboard_e7cd3b4c36c58c3ce5bbabd056fe06c3e.png

Figure 4-12 for completed Venn Diagram. Note that you do not need to use circles to represent the sets.

clipboard_e941123bf5851172d0474eed29e843320.png

Figure 4-12

A random sample of 500 people was taken from the 2010 United States Census. Their marital status and race were recorded in the following contingency table using the census labels. A person is randomly chosen from the census data. Find the following.

  Race   Marital Status American Indian Black Asian White Two Major Races Total Divorced 0 6 1 30 1 38 Married 1 25 23 156 4 209 Single 2 33 21 155 11 222 Widowed 0 7 2 22 0 31 Total 3 71 47 363 16 500

a) P (Single ∩ American Indian)

b) P(Single U American Indian)

c) Probability that the person is Asian or Married.

d) P(Single ∩ Married)

e) P(Single U Married)

Solution

a) The intersection for a contingency table is found by simply finding where the row or intersection meets. There are 2 Single American Indians, therefore the P(Single ∩ American Indian) = P(Single and American Indian) = 2/500 = 0.004.

b) There are 222 Single people, there are 3 American Indians, but we do not want to count the 2 Single American Indians twice, therefore the P(Single U American Indian) = P(Single or American Indian) = 222/500 + 3/500 – 2/500 = 223/500 = 0.446.

c) The union for a contingency table is found by either using the union formula or adding up all the numbers in the corresponding row and column. There are 47 Asian people, there are 209 Married people, but we do not want to count the 23 Married Asian people twice, therefore the P(Asian U Married) = P(Asian or Married) = 47/500 + 209/500 – 23/500 = 233/500 = 0.466.

d) The events Single and Married are mutually exclusive so the P(Single ∩ Married) = 0. Alternatively, there is no place in the table where the Single row and Married row meet.

e) The events single and married are mutually exclusive so the P(Single U Married) = P(Single) + P(Married) – P(Single ∩ Married) = 222/500 + 209/500 – 0 = 431/500 = 0.862.

Use a random experiment consisting of rolling two dice and adding the numbers on the faces.

a) Compute the probability of rolling a sum of 8.

b) Compute the probability of rolling a sum of 8 or a sum of 5

c) Compute the probability of rolling a sum of 8 or a double (each die has the same number).

Solution

a) There are 36 possible outcomes for rolling the two dice as shown in the following sum table. There are 5 pairs where the sum of the two dice is an 8, the (2,6), (3,5), (4,4), (5,3) and (6,2). Note that the events (2,6) and (6,2) are different outcomes since they numbers come from different dice.

clipboard_e60cc0064502a06f179f2d222b15b270e.png

Thus, the P(8) = 5/36 = 0.1389.

b) Highlight all the places where a sum of 5 or a sum of 8 occurs. There are 9 pairs where the sum of the two dice is a 5 or an 8.

clipboard_e41f3f0b224fcfdde61ff64083c746e33.png

Thus, the P(5 U 8) = P(5) + P(8) – P(5 ∩ 8) = 4/36 + 5/36 – 0 = 9/36 = 0.25.

Note that rolling a sum of 5 is mutually exclusive from rolling a sum of 8 so the probability is zero for the intersection of the two events.

c) The events rolling an 8 and rolling doubles are not mutually exclusive since the pair of fours (4, 4) falls into both events.

An easy way is to highlight all the places a sum 8 or doubles occur, count the highlighted values, and divide by the total 10/36 = 0.2778.

clipboard_e950a5e80910a6f2419a3ec7dfb08629e.png

When using the union rule, we subtract this overlap out one time to account for this. Using the union formula:

P(8 U Doubles) = P(8) + P(Doubles) – P(8 ∩ Doubles) = 5/36 + 6/36 – 1/36 = 10/36 = 0.2778.

“‘It's... well, it's a long story,’ he said, ‘but the Question I would like to know is the Ultimate Question of Life, the Universe and Everything. All we know is that the Answer is Forty-two, which is a little aggravating.’

Prak nodded again.

‘Forty-two,’ he said. ‘Yes, that's right.’

He paused. Shadows of thought and memory crossed his face like the shadows of clouds crossing the land.

‘I'm afraid,’ he said at last, ‘that the Question and the Answer are mutually exclusive. Knowledge of one logically precludes knowledge of the other. It is impossible that both can ever be known about the same universe.’”

(Adams, 2002)

Randomly pick a card from a standard deck. A standard deck of cards, not including jokers consists of 4 suits called clubs = ♣, spades = ♠, hearts = ♥, and diamonds = ♦. The clubs and spades are called the black cards. The hearts and diamonds are called the red cards. Each suit has 13 cards. The numbered cards shown in Figure 4-13, are Ace = 1 or A, 2, 3, 4, 5, 6, 7, 8, 9, 10. The face cards are the Jack = J, Queen = Q, and King = K.

clipboard_ea16f4eb009465a3318ed73562ab02b41.png

Figure 4-13

a) Compute the probability of selecting a card that shows a club.

b) Compute the probability of selecting a heart or a spade card.

c) Compute the probability of selecting a spade or a face card.

Solution

a) There are 52 cards in a standard deck. There are 13 cards of each suit. The P(♣) = 13/52 = 0.25.

b) There are 52 cards in a standard deck. There are 13 cards of each suit. P(♥ U ♠) = 26/52 = 0.5.

c) There are 13 spades and 12 face cards. However, there are 3 cards that are both spades and face cards. P(♠ U FC) = P(♠) + P(FC) – P(♠ ∩ FC) = 13/52 + 12/52 – 3/52 = 22/52 = 0.4231. Since the sample space is small, you could just count how many spades and face cards there are.

clipboard_ebd7bb43dd9e363666bf3538a30ca392a.png

Words Are Important!

When working with probability, words such as “more than” or “less than” can drastically change the answer. Figure 4-14 shows some of the common phrases you may run into while reading a problem. It will be essential later in the course that you can correctly match these phrases with their correct symbol.

clipboard_e5653aba61c414ecd38e77173c6db50de.png

Figure 4-14

Use a random experiment consisting of rolling two dice and adding the numbers on the faces.

a) Compute the probability of rolling a sum of less than 5.

b) Compute the probability of rolling a sum of 5 or less.

Solution

a) Let X be the event rolling a sum less than 5. A sum less than 5 would not include the 5. For notation, we use P(X < 5), which is read as the “probability that X is less than five.” Shade in all the sums that are less than 5.

clipboard_e7ef2834f51b9ea7bbd99a618f6d862d9.png

Then the P(X < 5) = 6/36 = 0.1667.

b) : Let X be the event rolling a sum of 5 or less. A sum of 5 or less includes the 5. For notation, we can use P(X ≤ 5), which is read as the “probability that X is less than or equal to five.” Shade in all the sums that are 5 or less.

clipboard_e447a1bc541bfce5552fef12fe09e77a3.png

Then the P(X ≤ 5) = 10/36 = 0.2778.

4.05: Independent Events

Two trials (or events or results of a random experiment) are independent trials if the outcome of one trial does not influence the outcome of the second trial. If two events are not independent, they are dependent events. For instance, if two coins are flipped they are independent since flipping one coin does not affect the outcome of the second coin.

Independent Events: If A and B are independent events, then P(A ∩ B) = P(A) ‧ P(B).

Be careful with this rule. You cannot just multiply probabilities to find an intersection unless you know they are independent. Also, do not confuse independent events with mutually exclusive events. Two events are mutually exclusive when the P(A ∩ B) = 0.

If a random experiment consists of flipping a coin twice, find the probability of getting heads twice in a row.

Solution

The event of getting a head on the first flip is independent of getting a head on the second flip since the probability does not change with each flip of the coin. Thus, using the multiplication rule of independent events, P(Both coins are heads) = P(1st coin is a head)·P(2nd coin is a head) = \(\frac{1}{2}\)
∙ \(\frac{1}{2}\) = \(\frac{1}{4}\) = 0.25.

The probability of Apple stock rising is 0.3, the probability of Boeing stock rising is 0.4. Assume Apple and Boeing stocks are independent. What is the probability that neither stock rises?

Solution

Let A = Apple stock and B = Boeing stock. Since A and B are independent the probability of both stocks rising at the same time is P(A ∩ B) = 0.3 ‧ 0.4 = 0.12. Neither is the complement to either. P(Not Either) = 1 – P(A U B) = 1 – (P(A) + P(B) – P(A ∩ B)) = 1 – (0.3 + 0.4 + 0.12) = 1 – 0.58 = 0.42.

The probability that a student has their own laptop is 0.78. If three students are randomly selected, what is the probability that at least one owns a laptop?

Solution

There is an assumption that the three students are not related and that the probability of one owning a laptop is independent of the other people owning a laptop. The probability of none owning a laptop is (1 – 0.78)3 = 0.0106. The probability of at least one is the same as 1 – P(None) = 1 – 0.0106 = 0.9894.

When two events are dependent, you cannot simply multiply their corresponding probabilities to find their intersection. You will need to use the General Multiplication Rule discussed in the next section.

4.06: Conditional Probability

The probability of event B happening, given that event A already happened, is called the conditional probability. The conditional probability of B, given A is written as P(B | A), and is read as “the probability of B given A happened first.” We can use the General Multiplication Rule when two events are dependent.

Definition: General Multiplication Rule

\[\begin{align*} P(A ∩ B) &= P(A) \cdot P(B | A) P(A ∩ B) \\[4pt] &= P(A) \cdot P(B|A) \end{align*}\]

A bag contains 10 colored marbles: 7 red and 3 blue. A random experiment consists of drawing a marble from the bag, then drawing another marble without replacement (without putting the first marble back in the bag). Find the probability of drawing a red marble on the first draw (event R1), and drawing another red marble on the second draw (event R2).

Solution

Drawing a red marble on the first draw and drawing a red marble on the second draw are dependent events because we do not place the marble back in the bag. The probability of drawing a red marble on the first draw is P(R1) = \(\frac{7}{10}\), but on the second draw, the probability of drawing a red marble given that a red marble was drawn on the first draw is P(R2|R1) = \(\frac{6}{9}\).

Thus, by the general multiplication rule, P(R1 and R2) = P(R1)·P(R2|R1) = ( \(\frac{7}{10}\) ) ( \(\frac{6}{9}\) ) = 0.4667.

A bag contains 10 colored marbles: 7 red and 3 blue. A random experiment consists of drawing a marble from the bag, then drawing another marble without replacement. Create the tree diagram for this experiment and compute the probabilities of each outcome.

Solution

clipboard_ee5beca853fff6d122e2c96d9785fcb1d.png

Figure 4-15

If we were to multiply the probabilities as we move from left to right up each set of tree branches as shown in Figure 4-15, we get the intersections. For example, by the general multiplication rule, P(R1 and R2) = P(R1)·P(R2|R1) = ( \(\frac{7}{10}\) ) ( \(\frac{6}{9}\) ) = 0.4667.

Put the four intersection values into a contingency table and total the rows and columns. The table will help solve probability questions of other events.

R2 B2 Total
R1 0.4667 0.2333 0.7
B1 0.2333 0.0667 0.3
Total 0.7 0.3 1

The grand total should add up to 1 since we have 100% of the sample space.

Conditional Probability Rule: P (A |B ) = \(\frac{P(A \cap B)}{P(B)}\) or P (B |A ) = \(\frac{P(A \cap B)}{P(A)}\)

The following table shows the utility contract granted for a specific year. One contractor is randomly chosen.

Corporation Government Individual Total United States 0.45 0.007 0.08 0.537 Foreign 0.41 0.003 0.05 0.463 Total 0.86 0.01 0.13 1
  1. Compute the probability the contractor is from the United States and is a corporation.
  2. Compute the probability the contractor is from the United States given that they are a corporation.
  3. If the contractor is from a foreign country, what is the probability that it is from a government?
  4. Are the events a “contractor is an individual” independent of a “contractor from the United States?”
Solution

a) For the intersection in the contingency tables use where the row and column meet. P(U.S. ∩ Corp) = 0.45.

b) P (U.S.|Corp) = \(\frac{P(\text { U.S. ∩ Corp})}{P(\text {Corp})}\) = \(\frac{0.45}{0.86}\) = 0.5233.

c) P (Gov|Foreign) = \(\frac{P(\text { Gov ∩ Foreign})}{P(\text {Foreign})}\) = \(\frac{0.003}{0.463}\) = 0.0065.

d) Do not assume independence between two variables in a contingency table since the data may show relationships that you didn’t know were there.

Use the definition of independent events. If the two events are independent then we would have P(Individual ∩ U.S.) = P(Individual)·P(U.S.). First find the intersection using where the row and column meet to get P(Individual ∩ U.S.) = 0.08. Then use the row and column totals to find P(Individual)·P(U.S.) = 0.13·0.537 = 0.0698. Since P(Individual ∩ U.S.) ≠ P(Individual)·P(U.S.) these two events are dependent.

A random sample of 500 people was taken from the 2010 United States Census. Their marital status and race were recorded in the following contingency table. A person is randomly chosen, find the following.

Race Marital Status American Indian Black Asian White Two Major Races Total Divorced 0 6 1 30 1 38 Married 1 25 23 156 4 209 Single 2 33 21 155 11 222 Widowed 0 7 2 22 0 31 Total 3 71 47 363 16 500

a) P(Single and Asian)

b) P(Single | Asian)

c) Given that a person is single what is the probability their race is Asian?

Solution

a) The intersection for a contingency table is found by simply finding where the row or intersection meets. There are 21 single Asians, therefore the P(Single ∩ Asian) = P(Single and Asian) = 21/500 = 0.042. Do not multiply the row total times the column total since there is no indication that these are independent events.

b) In words we are trying to find the probability that the person is single given that we already know that their race is Asian. Using the conditional probability formula, we get P(Single | Asian) = \(\frac{P(\text { Single ∩ Asian})}{P(\text {Asian})}\) = \(\frac{21}{47}\) = 0.4468.

c) This seems similar to the last question, however the part we know is that the person is single, but we do not know their race. In symbols we want to find the P(Asian | Single) = \(\frac{P(\text { Asian ∩ Single})}{P(\text {Single})}\)= \(\frac{21}{222}\) = 0.0946.

Keep in mind that P(A | B) ≠ P(B | A) since we would divide by a different total in the equation.

A blood test correctly detects a certain disease 95% of the time (positive result), and correctly detects no disease present 90% of the time (negative result). It is estimated that 25% of the population have the disease. A person takes the blood test and they get a positive result. What is the probability that they have the disease?

Solution

Let D = Having the Disease, DC = Not having the disease, + is a positive result, and – is a negative result. We are given in the problem the following: P(+ | D) = 0.95, P(– | DC ) = 0.90, P(D) = 0.25. We want to find P (D|+) = \(\frac{P(D \cap+)}{P(+)}\).

clipboard_e0440cad1f6d092692f7e7229aed3c6ad.png

Figure 4-16

When you multiply up each pair of tree branches from left to right as shown in Figure 4-16, you are finding the intersection of the events. Place the multiplied values into a table. Note that the 0.2375 is not our answer. This is the people who have the disease and tested positive, but does not take into consideration the false positives. Since we know that the result was positive, we only divide by the proportion of positive results.

DC D Total
+ 0.075 0.2375 0.3125
0.675 0.0125 0.6875
Total 0.75 0.25 1

\[P (D|+) = \frac{P(D \cap+)}{P(+)} = \frac{0.2375}{0.3125} = 0.76\]

There is a 76% chance that they have the disease given that they tested positive. Many of the more difficult probability problems can be set up in a table, which makes the probabilities easier to find.

4.07: Counting Rules

There are times when the sample space is very large and is not feasible to write out. In that case, it helps to have mathematical tools for counting the size of the sample space. These tools are known as counting techniques or counting rules.

Fundamental Counting Rule: If task 1 can be done m1 ways, task 2 can be done m2 ways, and so forth to task n being done mn ways. Then the number of ways to do task 1, 2,…, n together would be to multiply the number of ways for each task m1·m2···mn.

A menu offers a choice of 3 salads, 8 main dishes, and 5 desserts. How many different meals consisting of one salad, one main dish, and one dessert are possible?

Solution

There are three tasks, picking a salad, a main dish, and a dessert. The salad task can be done 3 ways, the main dish task can be done 8 ways, and the dessert task can be done 5 ways. The ways to pick a salad, main dish, and dessert are: \(\frac{3}{\text { salad }} \cdot \frac{2}{\text { main }} \cdot \frac{1}{\text { dessert }}\) = 120 different meals.

How many 4-digit debit card personal identification numbers (PIN) can be made?

Solution

Four tasks must be done in this example. The tasks are to pick the first number, then the second number, then the third number, and then the fourth number. The first task can be done 10 ways since there are digits 1 through 9 or a zero. We can use the same numbers over again (repeats are allowed) to find that the second task can also be done 10 ways. The same with the third and fourth tasks, which also have 10 ways.

There are \(\frac{10}{\text { first number }} \cdot \frac{10}{\text { second number }} \cdot \frac{10}{\text { third number }} \cdot \frac{10}{\text { fourth number }}\) = 10,000 possible PINs.

How many ways can the three letters a, b, and c be arranged with no letters repeating?

Solution

Three tasks must be done in this case. The tasks are to pick the first letter, then the second letter, and then the third letter. The first task can be done 3 ways since there are 3 letters. The second task can be done 2 ways, since the first task took one of the letters (repeats are not allowed). The third task can be done 1 way, since the first and second task took two of the letters.

There are \(\frac{3}{1^{\text {st }} \text { letter }} \cdot \frac{2}{2^{\text {nd }} \text { letter }} \cdot \frac{1}{3^{\text {rd }} \text { letter }}\)

You can also look at this example in a tree diagram, see Figure 4-17. There are 6 different arrangements of the letters. The solution was found by multiplying 3·2·1 = 6.

clipboard_ed386873e8cf26591a34435d158422a3b.png

Figure 4-17

If we have 10 different letters for, say, a password, the tree diagram would be very time-consuming to make because of the length of options and tasks, so we have some shortcut formulas that help count these arrangements.

Many counting problems involve multiplying a list of decreasing numbers, which is called a factorial. The factorial is represented mathematically by the starting number followed by an exclamation point, in this case 3! = 3·2·1 = 6. There is a special symbol for this and a special button on your calculator or computer.

Factorial Rule: The number of different ways to arrange n objects is n! = n·(n – 1)·(n – 2) ···3·2·1, where repetitions are not allowed.

Zero factorial is defined to be 0! = 1, and 1 factorial is defined to be 1! = 1.

TI-84: On the home screen, enter the number of which you would like to find the factorial. Press [MATH]. Use cursor keys to move to the PRB menu. Press 4 (4:!) Press [ENTER] to calculate.

TI-89: On the home screen, enter the number of which you would like to find the factorial. Press [2nd] [Math] > 7:Probability > 1:!. Press [ENTER] to calculate.

Excel: In an empty cell type in =FACT(n) where n is the number so 4! would be =FACT(4).

How many ways can you arrange five people standing in line?

Solution

No repeats are allowed since you cannot reuse a person twice. Order is important since the first person is first in line and will be selected first. This meets the requirements for the factorial rule,

5! = 5·4·3·2·1 = 120 ways.

Sometimes we do not want to select the entire group but only select r objects from n total objects. The number of ways to do this depends on if the order you choose the r objects matters or if it does not matter. As an example, if you are trying to call a person on the phone, you have to have the digits of their number in the correct order. In this case, the order of the numbers matters. If you were picking random numbers for the lottery, it does not matter which number you pick first since they always arrange the numbers from the smallest to largest once the numbers are drawn. As long as you have the same numbers that the lottery officials pick, you win. In this case, the order does not matter.

A permutation is an arrangement of items with a specific order. You use permutations to count items when the order matters.

Permutation Rule: The number of different ways of picking r objects from n total objects when repeats are not allowed and order matters \({ }_{\mathrm{n}} \mathrm{P}_{\mathrm{r}}=\frac{n !}{(n-r) !}\).

When the order does not matter, you use combinations. A combination is an arrangement of items when order is not important. When you do a counting problem, the first thing you should ask yourself is “are repeats allowed,” then ask yourself “does order matter?”

Combination Rule: The number of ways to select r objects from n total objects when repeats are not allowed and order does not matter \({ }_{\mathrm{n}} \mathrm{C}_{\mathrm{r}}=\frac{n !}{(r !(n-r) !)}\).

TI-84: Enter the number “trials” (n) on the home screen. Press [MATH]. Use cursor keys to move to the PRB menu. Press 2 for permutation (2: nPr), 3 for combination (3: nCr). Enter the number of “successes” (r). Press [ENTER] to calculate.

TI-89: Press [2nd] Math > 7:Probability > Press 2 for permutation (2: nPr), 3 for combination (3: nCr). Enter the sample size on the home screen, then a comma, then enter the number of “successes,” then end the parenthesis. Press [ENTER] to calculate.

Excel: In a blank cell type in the formula =COMBIN(n, r) or =PERMUT(n, r) where n is the total number of objects and r is the smaller number of objects that you are selecting out of n. For example =COMBIN(8, 3).

The following flow chart in Figure 4-18 may help with deciding which counting rule to use.

Start on the left; ask yourself if the same item can be repeated. For instance, a person on a committee cannot be counted as two distinct people; however, a number on a car license plate may be used twice. If repeats are not allowed, then ask, does the order in which the item is chosen matter? If it does not then we use the combinations, if it does then ask are you ordering the entire group, use factorial, or just some of the group, use permutation.

clipboard_e38e3dd19f5aae8fb6c3abb177925b03c.png

Figure 4-18

Critical Miss, PSU's Tabletop Gaming Club, has 15 members this term. How many ways can a slate of 3 officers consisting of a president, vice-president, and treasurer be chosen?

Solution

In this case, repeats are not allowed since we don’t want the same member to hold more than one position. The order matters, since if you pick person 1 for president, person 2 for vice-president, and person 3 for treasurer, you would have different members in those positions than if you picked person 2 for president, person 1 for vice-president, and person 3 for treasurer. This is a permutation problem with n = 15 and r = 3.

\(
{ }_{15} \mathrm{P}_{3}=\frac{15 !}{(15-3) !}=\frac{15 !}{12 !}=2730
\)
There are 2,730 ways to elect these three positions.

In general, if you were selecting items that involve rank, a position title, 1st, 2nd, or 3rd place or prize, etc. then the order in which the items are arranged is important and you would use permutation.

Critical Miss, PSU's Tabletop Gaming Club, has 15 members this term. They need to select 3 members to have keys to the game office. How many ways can the 3 members be chosen?

Solution

In this case, repeats are not allowed, because we don’t want one person to have more than one key. The order in which the keys are handed out does not matter. This is a combination problem with n = 15 and r = 3.

\({ }_{15} \mathrm{C}_{3}=\frac{15 !}{(3 !(15-3) !)}=\frac{15 !}{(3 ! \cdot 12 !)}=455 \quad \text { There are } 455 \text { ways to hand out the three keys. }\)

We can use these counting rules in finding probabilities. For instance, the probability of winning the lottery can be found using these counting rules.

What is the probability of getting a full house if 5 cards are randomly dealt from a standard deck of cards?

Solution

A full house is a combined three of a kind and pair, for example, QQQ22. There are 13C1 ways to choose a card between Ace, 2, 3, … , King. Once a number is chosen, there are 4 cards with that rank and there are 4C3 ways to choose a three of kind from that rank. Once we use up one of the ranks, such as the three queens, there are 12C1 ways to choose the rank for the pair. Once the pair is chosen there are 4C2 ways to choose a pair from that rank. All together there are 52C5 ways to randomly deal out 5 cards. The probability of getting a full house with then be

\(\frac{_{13} C_{1} \cdot{ }_{4} C_{3} \cdot{ }_{12} C_{1} \cdot{ }_{4} C_{2}}{_{52} C_{5}}\) = \(\frac{3744}{2598960}\) = 0.00144

4.08: Chapter 4 Formulas

Complement Rules: P(A) + P(AC) = 1

P(A) = 1 – P(AC)

P(AC) = 1 – P(A)

Mutually Exclusive Events: P(A ∩ B) = 0
Union Rule: P(A U B) = P(A) + P(B) – P(A ∩ B) Independent Events: P(A ∩ B) = P(A) ‧ P(B)
Intersection Rule: P(A ∩ B) = P(A) ‧ P(B|A) Conditional Probability Rule: \(P(A \mid B)=\frac{P(A \cap B)}{P(B)}\)
Fundamental Counting Rule: m1·m2···mn Factorial Rule: n! = n·(n – 1)·(n – 2)···3·2·1
Combination Rule: \({ }_{\mathrm{n}} \mathrm{C}_{\mathrm{r}}=\frac{n !}{(r !(n-r) !)}\) Permutation Rule: \({ }_{\mathrm{n}} \mathrm{P}_{\mathrm{r}}=\frac{n !}{(n-r) !}\)

4.09: Chapter 4 Exercises

Chapter 4 Exercises

1. The number of M&M candies for each color found in a case were recorded in the table below.

Blue Brown Green Orange Red Yellow Total
481 371 483 544 372 369 2,620

What is the probability of selecting a red M&M?

2. An experiment is to flip a fair coin three times. Write out the sample space for this experiment.

3. An experiment is to flip a fair coin three times. What is the probability of getting exactly two heads?

4. In the game of roulette, there is a wheel with spaces marked 0 through 36 and a space marked 00. Compute the probability of winning if you pick the number 30 and it comes up on the wheel.

5. A raffle sells 1,000 tickets for $35 each to win a new car. What is the probability of winning the car?

6. Compute the probability of rolling a sum of two dice that is more than 7.

7. Compute the probability of rolling a sum of two dice that is a 7 or a 12.

8. A random sample of 500 people’s marital status and biological sex from the 2010 United States Census are recorded in the following contingency table.

clipboard_e2d605de6476b95b211b6871d817e1345.png

a) Compute the probability that a randomly selected person is single.

b) Compute the probability that a randomly selected person is not single.

c) Compute the probability that a randomly selected person is single or male.

d) Compute the probability that a randomly selected person is divorced or widowed.

e) Given that randomly selected person is male, what is the probability they are single?

f) Are the events divorced and male mutually exclusive?

g) Are the events divorced and male independent? Verify using statistics.

9. The probability that a consumer entering a retail outlet for microcomputers and software packages will buy a computer of a certain type is 0.15. The probability that the consumer will buy a particular software package is 0.10. There is a 0.05 probability that the consumer will buy both the computer and the software package. What is the probability that the consumer will buy the computer or the software package?

10. A fitness center owner kept track of members over the last year. They recorded if the person stretched before they exercised, and whether they sustained an injury. The following contingency table shows their results. Select one member at random and find the following.

  Injury No Injury Total
Stretched 52 270 322
Did Not Stretch 21 57 78
Total 73 327 400

a) P(No Injury)

b) P(Injury ∩ Stretch)

c) Compute the probability that a randomly selected member stretched or sustained an injury.

d) Compute the probability that a randomly selected member stretched given that they sustained an injury.

e) P(Injury | Did Not Stretch)

11. Giving a test to a group of students, the grades and if they were business majors are summarized below. One student is chosen at random. Give your answer as a decimal out to at least 4 places.

  A B C Total
Business Majors 4 5 13 22
Non-business Majors 18 10 19 47
Total 22 15 32 69

a) Compute the probability that the student was a non-business major or got a grade of C.

b) Compute the probability that the student was a non-business major and got a grade of C.

c) Compute the probability that the student was a non-business major given they got a C grade.

d) Compute the probability that the student did not get a B grade.

e) Compute P(B ∪ Business Major).

f) Compute P(C | Business Major).

12. A poll showed that 48.7% of Americans say they believe that Marilyn Monroe had an affair with JFK. What is the probability of randomly selecting someone who does not believe that Marilyn Monroe had an affair with JFK.

13. Your favorite basketball player is an 81% free throw shooter. Find the probability that they do not make their next free throw shot.

14. A report for a school's computer web visits for the past month obtained the following information. Find the percentage that visited none of these three sites last month. Hint: Draw a Venn Diagram.

37% visited Facebook.

42% visited LinkedIn.

29% visited Google.

27% visited Facebook and LinkedIn.

19% visited Facebook and Google.

19% visited LinkedIn and Google.

14% visited all three sites.

15. The smallpox data set provides a sample of 6,224 individuals from the year 1721 who were exposed to smallpox in Boston.

  Inoculated Not Inoculated Total
Lived 238 5136 5374
Died 6 844 850
Total 244 5980 6224

Fenner F. 1988. Smallpox and Its Eradication (History of International Public Health, No. 6). Geneva: World Health Organization. ISBN 92-4-156110-6.

a) Compute the relative frequencies.

  Inoculated Not Inoculated Total
Lived      
Died      
Total     1

b) Compute the probability that a person was inoculated.

c) Compute the probability that a person lived.

d) Compute the probability that a person died or was inoculated.

e) Compute the probability that a person died if they were inoculated.

f) Given that a person was not inoculated, what is the probability that they died?

16. A certain virus infects one in every 400 people. A test used to detect the virus in a person is positive 90% of the time if the person has the virus and 8% of the time if the person does not have the virus. (This 8% result is called a false positive.) Let A be the event "the person is infected" and B be the event "the person tests positive."

a) Find the probability that a person has the virus given that they have tested positive, i.e. find P(A|B).

b) Find the probability that a person does not have the virus given that they test negative, i.e. find P(AC|BC).

17. A store purchases baseball hats from three different manufacturers. In manufacturer A’s box there are 12 blue hats, 6 red hats, and 6 green hats. In manufacturer B’s box there are 10 blue hats, 10 red hats, and 4 green hats. In manufacturer C’s box, there are 8 blue hats, 8 red hats, and 8 green hats. A hat is randomly selected. Given that the hat selected is green, what is the probability that it came from manufacturer B’s box? Hint: Make a table with the colors as the columns and the manufacturers as the rows.

18. The following table represents food purchase amounts and whether the customer used cash or a credit/debit card. One customer is chosen at random. Give your answer as a decimal out to at least 4 places.

  Less than $10 $10-$49 $50 or More Total
Cash Purchase 11 10 18 39
Card Purchase 17 6 19 42
Total 28 16 37 81

a) Compute the probability that the customer's purchasing method was a cash purchase or the customer spent $10-$49.

b) Compute the probability that the customer's purchasing method was cash purchase and the customer spent $10-$49.

c) Compute the probability that the customer's purchasing method was a cash purchase given they spent $10- $49.

d) Compute the probability that the customer spent less than $50.

e) What percent of cash purchases were for $50 or more?

19. The probability of stock A rising is 0.3; and of stock B rising is 0.4. What is the probability that neither of the stocks rise, assuming that these two stocks are independent?

20. You are going to a Humane Society benefit dinner, and need to decide before the dinner what you want for salad, main dish, and dessert. You have 2 salads to choose from, 3 main dishes, and 5 desserts. How many different meals are available?

21. How many different phone numbers are possible in the area code 503, if the first number cannot start with a 0 or 1?

22. You are opening a screen-printing business. You can have long sleeves or short sleeves, three different colors, five different designs, and four different sizes. How many different shirts can you make?

23. The California license plate has one number followed by three letters followed by three numbers. How many different license plates are possible?

24. Calculate the following.

a) 9P4

b) 10P6

c) 10C5

d) 20C4

e) 8!

f) 5!

25. The PSU’s Mixed Me club has 30 members. You need to pick a president, treasurer, and secretary from the 30. How many different ways can you do this?

26. How many different 4-digit personal identification numbers (PIN) are there if repeats are not allowed?

27. A baseball team has a 20-person roster. A batting order has nine people. How many different batting orders are there?

28. How many ways can you choose 4 cookies from a cookie jar containing 25 cookies of all the same type?

29. A computer generates a random password for your account (the password is not case sensitive). The password must consist of 8 characters, each of which can be any letter or number. How many different passwords could be generated?

30. How many unique tests can be made from a test bank of 20 questions if the test consists of 8 questions, order does not matter?

31. A typical PSU locker is opened with correct sequence of three numbers between 0 and 49 inclusive. A number can be used more than once, for example 8-8-8 is valid. How many possible locker combinations are there?

32. In the game of Megabucks, you get six numbers from 48 possible numbers without replacement. Megabucks jackpots start at $1 million and grow until someone wins. What is the probability of matching all 6 numbers in any order?

Answer to Odd Numbered Exercises

1) 0.1420

3) 0.375

5) 0.001

7) 0.1944

9) 0.2

11) a) 0.8696 b) 0.2754 c) 0.5938 d) 0.7826 e) 0.4638 f) 0.5909

13) 0.19

15) a)

  Inoculated Not Inoculated Total
Lived 0.0382 0.8252 0.8634
Died 0.0010 0.1356 0.1366
Total 0.0392 0.9608 1

b) 0.0392 c) 0.8634 d) 0.1748 e) 0.0246 f) 0.141

17) 0.2222

19) 0.42

21) 8,000,000

23) 138,240,000

25) 24,360

27) 60,949,324,800

29) 2,821,109,907,456

31) 125,000

From Mostly Harmless Statistics by Rachel L. Webb, adapted from LibreTexts. Licensed CC BY-SA 4.0. XYZ Homework OER web edition, adapted with 7 verified corrections (see errata).