
4.1 Introduction
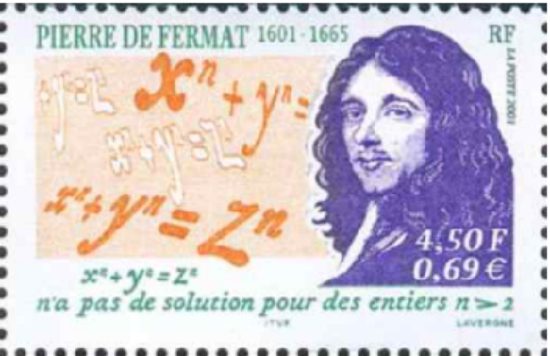
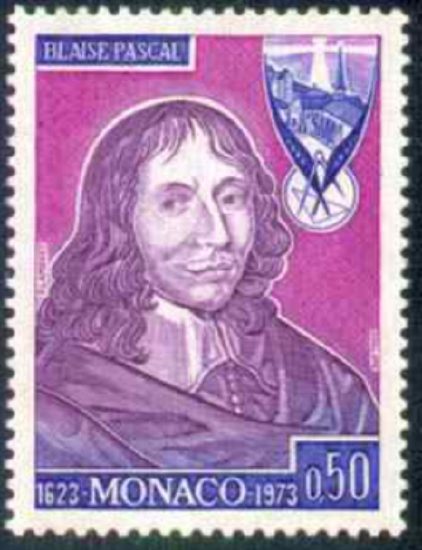
One story about how probability theory was developed is that a gambler wanted to know when to bet more and when to bet less. He talked to a couple of friends of his that happened to be mathematicians. Their names were Pierre de Fermat and Blaise Pascal. Since then many other mathematicians have worked to develop probability theory.
Understanding probability is important in life. Examples of mundane questions that probability can answer for you are: do I need to carry an umbrella? Do you wear a heavy coat on a given day? More important questions that probability can help with are your chances that the car you are buying will need more maintenance, your chances of passing a class, your chances of winning the lottery, or your chances of catching a deadly virus. The chance of you winning the lottery is very small, yet many people will spend the money on lottery tickets. In general, events that have a low probability (under 5%) are unlikely to occur. Whereas if an event has a high probability of happening (over 80%), then there is a good chance that the event will happen. This chapter will present some of the theory that you need to help decide if an event is likely to happen or not.
First, some definitions:
Here are some examples of sample spaces and events.
| Experiment | Sample Space | Example of Event |
|---|---|---|
| Toss a coin twice | {HH, HT, TH, TT} | A = Getting exactly two heads = {HH} |
| Toss a coin twice | {HH, HT, TH, TT} | B = Getting at least one head = {HH, HT, TH} |
| Roll a die | {1, 2, 3, 4, 5, 6} | C = Roll an odd number = {1, 3, 5} |
| Roll a die | {1, 2, 3, 4, 5, 6} | D = Roll a prime number = {2, 3, 5} |
| Roll a die | {1, 2, 3, 4, 5, 6} | E = Roll an even number = {2, 4, 6} |
A tree diagram is a graphical way of representing a random experiment with multiple steps
Adapted from Mostly Harmless Statistics by Rachel Webb (Portland State University, https://mostlyharmlessstat.wixsite.com/webpage), © Rachel Webb, licensed under CC BY-SA 4.0. Changes were made. License: CC-BY-SA-4.0.