
5.3 Geometric Distributions
The geometric distribution is a discrete probability distribution used to find the probability of success when there are two outcomes to each trial, and the trials are independent with the same probability of occurrence. A geometric probability distribution results from a random experiment that meets all of the following requirements.
- Repeat the trials until you get a success.
- The trials must be independent.
- Each trial must have exactly two categories that can be labeled “success” and “failure.”
- The probability of a “success,” denoted by p, remains the same in all trials. The probability of “failure” is often denoted by q, thus q = 1– p.
- Random Variable, X, counts the number of trials until your first success
If a random experiment satisfies all of the above, the distribution of the random variable X, where X counts the number of trials until the first success, is called a geometric distribution. If a discrete random variable X has a geometric distribution with the probability of success is p, we write X ~ G(p).
Be careful, a “success” is not always a “good” thing. Sometimes a success is something that is “bad,” like finding a defect or getting in a car crash. The success will be the event from the probability question.
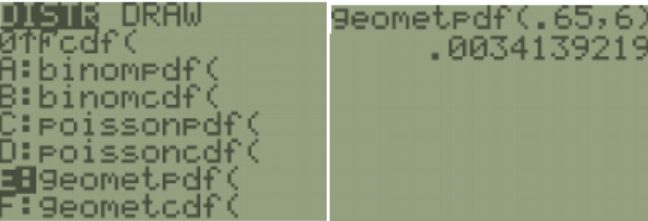
TI-84: Press [2nd] [DISTR]. This will get you a menu of probability distributions. Press 0 or arrow down to geometpdf( and press [ENTER]. This puts geometpdf( on the home screen. Enter the values for p and x with a comma between each. Press [ENTER]. This is the probability density function and will return you the probability of exactly x successes. For the previous example, we would use geometpdf(0.65,6).
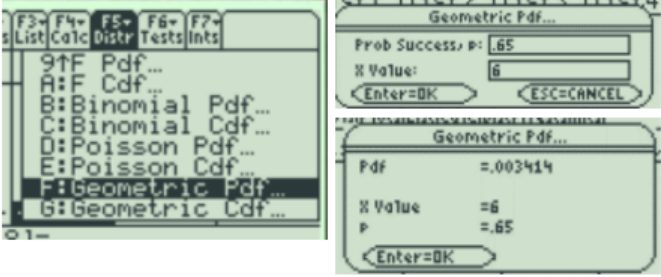
TI-89: Go to the [Apps] Stat/List Editor, then select F5 [DISTR]. This will get you a menu of probability distributions. Arrow down to Geometric Pdf and press [ENTER]. Enter the values for p and x into each cell. Press [ENTER]. This gives the probability density function and will return you the probability of exactly x successes.
Mean, Variance & Standard Deviation of a Geometric Distribution
For a geometric distribution, μ, the expected number of successes, σ2, the variance, and σ, the standard deviation for the number of success are given by the formulas, where p is the probability of success and q = 1 – p.
Adapted from Mostly Harmless Statistics by Rachel Webb (Portland State University, https://mostlyharmlessstat.wixsite.com/webpage), © Rachel Webb, licensed under CC BY-SA 4.0. Changes were made. License: CC-BY-SA-4.0.