
1.2 Relations
From one point of view,1 all of Precalculus can be thought of as studying sets of points in the plane. With the Cartesian Plane now fresh in our memory we can discuss those sets in more detail and as usual, we begin with a definition.
Since relations are sets, we can describe them using the techniques presented in Section 1.1.1. That is, we can describe a relation verbally, using the roster method, or using set-builder notation. Since the elements in a relation are points in the plane, we often try to describe the relation graphically or algebraically as well. Depending on the situation, one method may be easier or more convenient to use than another. As an example, consider the relation . As written, is described using the roster method. Since consists of points in the plane, we follow our instinct and plot the points. Doing so produces the graph of .
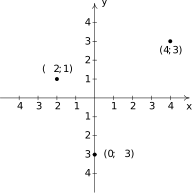
In the following example, we graph a variety of relations.
The relations and in the previous example lead us to our final way to describe relations: algebraically. We can more succinctly describe the points in as those points which satisfy the equation `'. Most likely, you have seen equations like this before. Depending on the context, `' could mean we have solved an equation for and arrived at the solution . In this case, however, `' describes a set of points in the plane whose -coordinate is . Similarly, the relation above can be described by the equation `'. At some point in your mathematical upbringing, you probably learned the following.
Equations of Vertical and Horizontal Lines
- The graph of the equation is a vertical line through .
- The graph of the equation is a horizontal line through .
Given that the very simple equations and produced lines, it's natural to wonder what shapes other equations might yield. Thus our next objective is to study the graphs of equations in a more general setting as we continue to unite Algebra and Geometry.
Graphs of Equations
In this section, we delve more deeply into the connection between Algebra and Geometry by focusing on graphing relations described by equations. The main idea of this section is the following.
The Fundamental Graphing Principle
The graph of an equation is the set of points which satisfy the equation. That is, a point is on the graph of an equation if and only if and satisfy the equation.
Here, ` and satisfy the equation' means ` and make the equation true'. It is at this point that we gain some insight into the word `relation'. If the equation to be graphed contains both and , then the equation itself is what is relating the two variables. More specifically, in the next two examples, we consider the graph of the equation . Even though it is not specifically spelled out, what we are doing is graphing the relation . The points we graph belong to the relation and are necessarily related by the equation , since it is those pairs of and which make the equation true.
We could spend hours randomly guessing and checking to see if points are on the graph of the equation. A more systematic approach is outlined in the following example.
Of all of the points on the graph of an equation, the places where the graph crosses or touches the axes hold special significance. These are called the intercepts of the graph. Intercepts come in two distinct varieties: -intercepts and -intercepts. They are defined below.
In our previous example the graph had two -intercepts, and , and one -intercept, . The graph of an equation can have any number of intercepts, including none at all! Since -intercepts lie on the -axis, we can find them by setting in the equation. Similarly, since -intercepts lie on the -axis, we can find them by setting in the equation. Keep in mind, intercepts are points and therefore must be written as ordered pairs. To summarize,
Finding the Intercepts of the Graph of an Equation
Given an equation involving and , we find the intercepts of the graph as follows:
- -intercepts have the form ; set in the equation and solve for .
- -intercepts have the form ; set in the equation and solve for .
Another fact which you may have noticed about the graph in the previous example is that it seems to be symmetric about the -axis. To actually prove this analytically, we assume is a generic point on the graph of the equation. That is, we assume is true. As we learned in Section 1.1, the point symmetric to about the -axis is . To show that the graph is symmetric about the -axis, we need to show that satisfies the equation , too. Substituting into the equation gives
Since we are assuming the original equation is true, we have shown that satisfies the equation (since it leads to a true result) and hence is on the graph. In this way, we can check whether the graph of a given equation possesses any of the symmetries discussed in Section 1.1. We summarize the procedure in the following result.
Testing the Graph of an Equation for Symmetry
To test the graph of an equation for symmetry
- about the -axis substitute into the equation and simplify. If the result is equivalent to the original equation, the graph is symmetric about the -axis.
- about the -axis – substitute into the equation and simplify. If the result is equivalent to the original equation, the graph is symmetric about the -axis.
- about the origin - substitute into the equation and simplify. If the result is equivalent to the original equation, the graph is symmetric about the origin.
Intercepts and symmetry are two tools which can help us sketch the graph of an equation analytically, as demonstrated in the next example.
A couple of remarks are in order. First, it is entirely possible to choose a value for which does not correspond to a point on the graph. For example, in the previous example, if we solve for as is our custom, we get
Upon substituting into the equation, we would obtain
which is not a real number. This means there are no points on the graph with an -coordinate of . When this happens, we move on and try another point. This is another drawback of the `plug-and-plot' approach to graphing equations. Luckily, we will devote much of the remainder of this book to developing techniques which allow us to graph entire families of equations quickly.6 Second, it is instructive to show what would have happened had we tested the equation in the last example for symmetry about the -axis. Substituting into the equation yields
This last equation does not appear to be equivalent to our original equation. However, to actually prove that the graph is not symmetric about the -axis, we need to find a point on the graph whose reflection is not. Our -intercept fits this bill nicely, since if we substitute into the equation we get
This proves that is not on the graph.
Exercises
In Exercises -, graph the given relation.
- {, , , , , ,
- {, , , , , ,
In Exercises -, describe the given relation using either the roster or set-builder method.
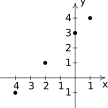
Figure 1.61 Relation 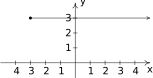
Figure 1.62 Relation 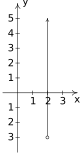
Figure 1.63 Relation 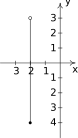
Figure 1.64 Relation 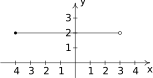
Figure 1.65 Relation 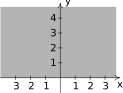
Figure 1.66 Relation 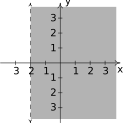
Figure 1.67 Relation 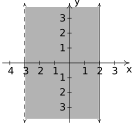
Figure 1.68 Relation 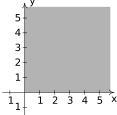
Figure 1.69 Relation 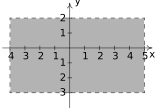
Figure 1.70 Relation
In Exercises -, graph the given line.
Some relations are fairly easy to describe in words or with the roster method but are rather difficult, if not impossible, to graph. Discuss with your classmates how you might graph the relations given in Exercises -. Please note that in the notation below we are using the ellipsis, …, to denote that the list does not end, but rather, continues to follow the established pattern indefinitely. For the relations in Exercises and, give two examples of points which belong to the relation and two points which do not belong to the relation.
For each equation given in Exercises -:
- Find the - and -intercept(s) of the graph, if any exist.
- Follow the procedure in Example 1.2.3 to create a table of sample points on the graph of the equation.
- Plot the sample points and create a rough sketch of the graph of the equation.
- Test for symmetry. If the equation appears to fail any of the symmetry tests, find a point on the graph of the equation whose reflection fails to be on the graph as was done at the end of Example 1.2.4
The procedures which we have outlined in the Examples of this section and used in Exercises - all rely on the fact that the equations were “well-behaved”. Not everything in Mathematics is quite so tame, as the following equations will show you. Discuss with your classmates how you might approach graphing the equations given in Exercises -. What difficulties arise when trying to apply the various tests and procedures given in this section? For more information, including pictures of the curves, each curve name is a link to its page at www.wikipedia.org. For a much longer list of fascinating curves, click here .
- Folium of Descartes
- Kampyle of Eudoxus
- Tschirnhausen cubic
- Crooked egg
With the help of your classmates, find examples of equations whose graphs possess
- symmetry about the -axis only
- symmetry about the -axis only
- symmetry about the origin only
- symmetry about the -axis, -axis, and origin
Can you find an example of an equation whose graph possesses exactly two of the symmetries listed above? Why or why not?
Answers
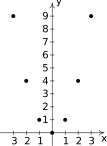
Figure 1.71 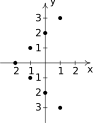
Figure 1.72 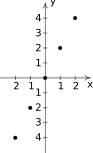
Figure 1.73 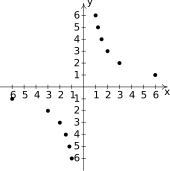
Figure 1.74 
Figure 1.75 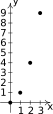
Figure 1.76 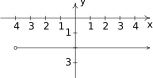
Figure 1.77 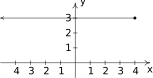
Figure 1.78 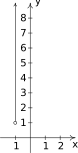
Figure 1.79 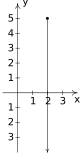
Figure 1.80 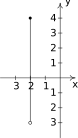
Figure 1.81 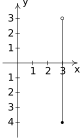
Figure 1.82 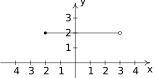
Figure 1.83 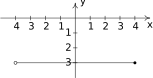
Figure 1.84 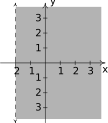
Figure 1.85 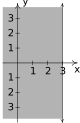
Figure 1.86 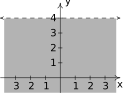
Figure 1.87 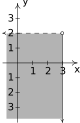
Figure 1.88 
Figure 1.89 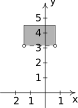
Figure 1.90 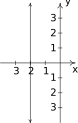
Figure 1.91 The line 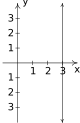
Figure 1.92 The line 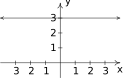
Figure 1.93 The line 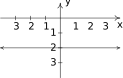
Figure 1.94 The line 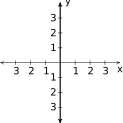
Figure 1.95 The line is the -axis 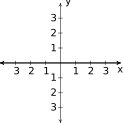
Figure 1.96 The line is the -axis The graph has no -intercepts
-intercept:

Figure 1.97 The graph is not symmetric about the -axis (e.g. is on the graph but is not)
The graph is symmetric about the -axis
The graph is not symmetric about the origin (e.g. is on the graph but is not)
-intercepts: ,
-intercept:
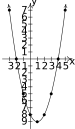
Figure 1.98 The graph is not symmetric about the -axis (e.g. is on the graph but is not)
The graph is not symmetric about the -axis (e.g. is on the graph but is not)
The graph is not symmetric about the origin (e.g. is on the graph but is not)
-intercepts:
-intercept:
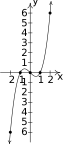
Figure 1.99 The graph is not symmetric about the -axis. (e.g. is on the graph but is not)
The graph is not symmetric about the -axis. (e.g. is on the graph but is not)
The graph is symmetric about the origin.
-intercepts:
-intercept:
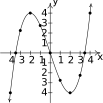
Figure 1.100 The graph is not symmetric about the -axis (e.g. is on the graph but is not)
The graph is not symmetric about the -axis (e.g. is on the graph but is not)
The graph is symmetric about the origin
-intercept:
The graph has no -intercepts
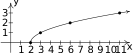
Figure 1.101 The graph is not symmetric about the -axis (e.g. is on the graph but is not)
The graph is not symmetric about the -axis (e.g. is on the graph but is not)
The graph is not symmetric about the origin (e.g. is on the graph but is not)
-intercept:
-intercept:

Figure 1.102 The graph is not symmetric about the -axis (e.g. is on the graph but is not)
The graph is not symmetric about the -axis (e.g. is on the graph but is not)
The graph is not symmetric about the origin (e.g. is on the graph but is not)
Re-write as: .
-intercept:
-intercept:
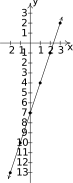
Figure 1.103 The graph is not symmetric about the -axis (e.g. is on the graph but is not)
The graph is not symmetric about the -axis (e.g. is on the graph but is not)
The graph is not symmetric about the origin (e.g. is on the graph but is not)
Re-write as: .
-intercepts:
-intercept:
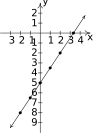
Figure 1.104 The graph is not symmetric about the -axis (e.g. is on the graph but is not)
The graph is not symmetric about the -axis (e.g. is on the graph but is not)
The graph is not symmetric about the origin (e.g. is on the graph but is not)
Re-write as .
-intercepts: ,
-intercepts:
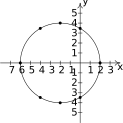
Figure 1.105 The graph is symmetric about the -axis
The graph is not symmetric about the -axis (e.g. is on the graph but is not)
The graph is not symmetric about the origin (e.g. is on the graph but is not)
Re-write as: .
-intercepts:
The graph has no -intercepts

Figure 1.106 The graph is symmetric about the -axis
The graph is symmetric about the -axis
The graph is symmetric about the origin
Re-write as: .
The graph has no -intercepts
-intercepts:
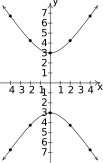
Figure 1.107 The graph is symmetric about the -axis
The graph is symmetric about the -axis
The graph is symmetric about the origin
Re-write as: .
The graph has no -intercepts
The graph has no -intercepts
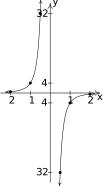
Figure 1.108 The graph is not symmetric about the -axis (e.g. is on the graph but is not)
The graph is not symmetric about the -axis (e.g. is on the graph but is not)
The graph is symmetric about the origin
Adapted from Precalculus, 3rd corrected edition, by Carl Stitz and Jeff Zeager (stitz-zeager.com), licensed under CC BY-NC-SA 3.0. Changes were made: reformatted as an accessible XYZ web edition. License: CC-BY-NC-SA-3.0.