
2.7 Box Plot Demo
This section is an interactive demonstration. The live simulation runs on the original site: open the demonstration at onlinestatbook.com.
Learning Objectives
- Understand what it means for a distribution to balance on a fulcrum
- Learn which measure of central tendency will balance a distribution.
Instructions
- The boxplot in the simulation is based on the data shown to the left of the boxplot.
- Notice that various aspects of the boxplot such as the mean and median are labeled.
- Beneath the data is a pair of buttons that let you specify whether you want to be able to enter data or to see statistics based on the data.
- When you use the simulation, try to modify the data in various ways and see how it affects the boxplot (see Video Demo).
- You can delete all the data (by pressing the "Clear All button") and enter your own data.
- These labels can be hidden by unchecking the "show labels on boxplot" button.
- Try putting in some extreme values and see if they get labeled as outliers.
- Outside values are shown as "o's" beyond the inner fence.
- Far out values are shown as *'s outside the outer fence.
- Your data can be typed in or pasted in from another application.
- When pasting, use keyboard shortcut for pasting (Command-V for Mac, CTRL-V for Windows).
- When you change the data, the boxplot will disappear.
After you have entered new data, click the "Draw boxplot" button to redraw the boxplot.
Illustrated Instructions
Video Demo
The screenshot below shows the boxplot simulation with its default data on the left.
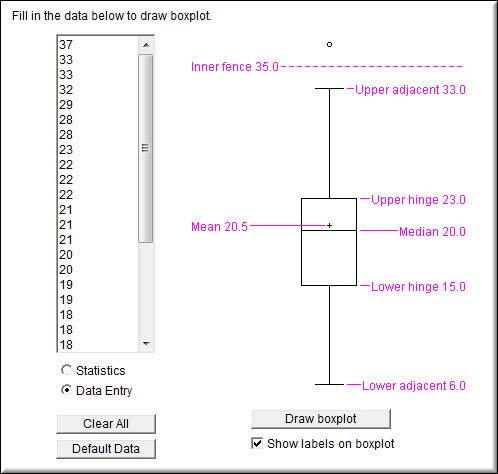
You can change some or all of the data on the left by editing individual numbers or pasting in your own data. When pasting, you must use the keyboard shortcut for pasting (Command-V for Mac, CTRL-V for Windows. As you can see in the video, the boxplot disappears when you change the data.
Video Demo
"Paint" the distributon with the mouse and observe the effects. The mean and median are shown to the left and also as small vertical bars below the X-axis. The mean is in blue and the median is in pink.
Watch the video demonstration (onlinestatbook.com)
Adapted from Online Statistics Education: A Multimedia Course of Study (onlinestatbook.com), Project Leader: David M. Lane, Rice University. Developed with NSF support. The original work is in the public domain; it is cited here at the authors' request. Changes were made: reformatted as an accessible XYZ web edition with native MathML. License: Public-Domain.