
2.10 Dot Plots
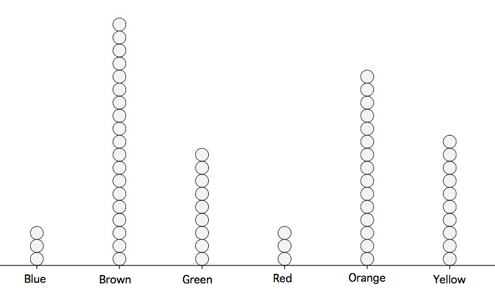
Dot plots can be used to display various types of information. Figure 1 uses a dot plot to display the number of M & M's of each color found in a bag of M & M's. Each dot represents a single M & M. From the figure, you can see that there were 3 blue M & M's, 19 brown M & M's, etc.
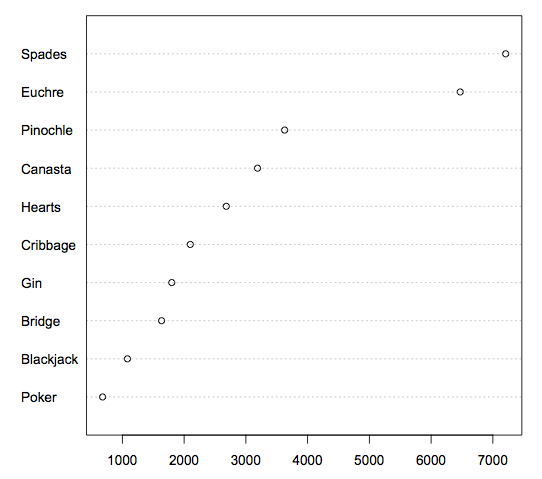
The dot plot in Figure 2 shows the number of people playing various card games on the Yahoo website on a Wednesday. Unlike Figure 1, the location rather than the number of dots represents the frequency.
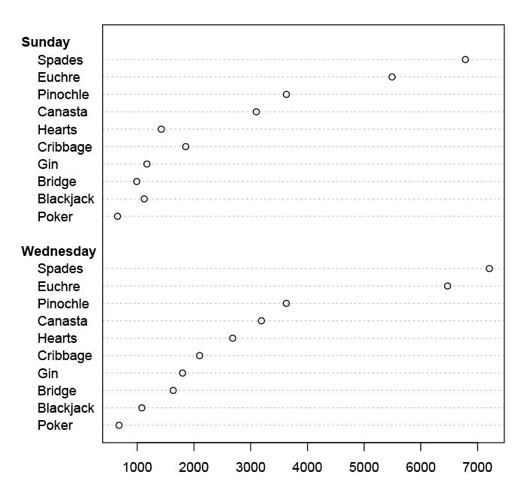
The dot plot in Figure 3 shows the number of people playing on a Sunday and on a Wednesday. This graph makes it easy to compare the popularity of the games separately for the two days, but does not make it easy to compare the popularity of a given game on the two days.
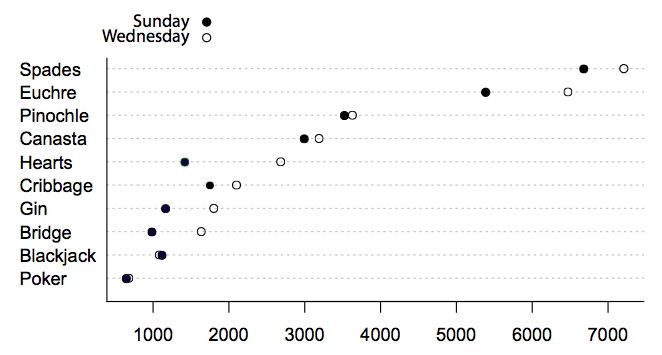
The dot plot in Figure 4 makes it easy to compare the days of the week for specific games while still portraying differences among games.
Adapted from Online Statistics Education: A Multimedia Course of Study (onlinestatbook.com), Project Leader: David M. Lane, Rice University. Developed with NSF support. The original work is in the public domain; it is cited here at the authors' request. Changes were made: reformatted as an accessible XYZ web edition with native MathML. License: Public-Domain.