
8.4 Hypothesis Test for One Proportion
When you read a question, it is essential that you correctly identify the parameter of interest. The parameter determines which model to use. Make sure that you can recognize and distinguish between a question regarding a population mean and a question regarding a population proportion.
The z-test is a statistical test for a population proportion. It can be used when np ≥ 10 and nq ≥ 10.
Use the phrases in Figure 8-24 to help with setting up the hypotheses.
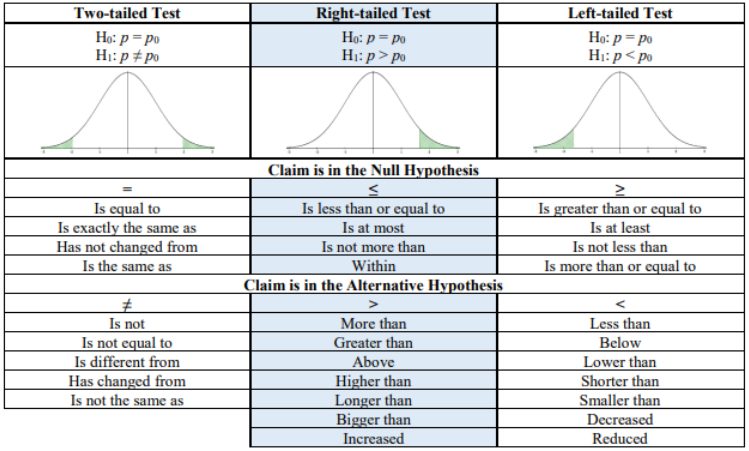
Figure 8-24
Note we will not be using the t-distribution with proportions. We will use a standard normal z distribution for testing a proportion since this test uses the normal approximation to the binomial distribution (never use the t-distribution).
If you are doing a left-tailed z-test the critical value will be negative. If you are performing a right-tailed z-test the critical value will be positive. If you were performing a two-tailed z-test then your critical values would be ±critical value. The p-value will always be a positive number between 0 and 1. The most important step in any method you use is setting up your null and alternative hypotheses. The critical values and p-value can be found using a standard normal distribution the same way that we did for the one sample z-test.
TI-84: Press the [STAT] key, arrow over to the [TESTS] menu, arrow down to the option [5:1-PropZTest] and press the [ENTER] key. Type in the hypothesized proportion (p0), x, sample size, arrow over to the , <, > sign that is the same in the problem’s alternative hypothesis statement then press the [ENTER] key, arrow down to [Calculate] and press the [ENTER] key.
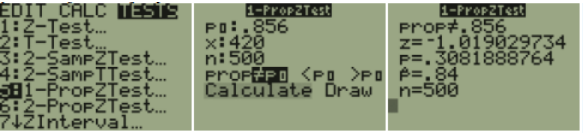
The calculator returns the z-test statistic and the p-value. Note: sometimes you are not given the x value but a percentage instead. To find the x to use in the calculator, multiply by the sample size and round off to the nearest integer. The calculator will give you an error message if you put in a decimal for x or n. For example, if = 0.22 and n = 124 then 0.22*124 = 27.28, so use x = 27.
TI-89: Go to the [Apps] Stat/List Editor, then press [2nd] then F6 [Tests], then select 5: 1-PropZ-Test. Type in the hypothesized proportion (p0), x, sample size, arrow over to the , <, > sign that is the same in the problem’s alternative hypothesis statement then press the [ENTER] key to calculate. The calculator returns the z-test statistic and the p-value. Note: sometimes you are not given the x value but a percentage instead. To find the x value to use in the calculator, multiply by the sample size and round off to the nearest integer. The calculator will give you an error message if you put in a decimal for x or n. For example, if = 0.22 and n = 124 then 0.22*124 = 27.28, so use x = 27.
Adapted from Mostly Harmless Statistics by Rachel Webb (Portland State University, https://mostlyharmlessstat.wixsite.com/webpage), © Rachel Webb, licensed under CC BY-SA 4.0. Changes were made. License: CC-BY-SA-4.0.