
8.1 Introduction
A statistic is a characteristic or measure from a sample. A parameter is a characteristic or measure from a population. We use statistics to generalize about parameters, known as estimations. Every time we take a sample statistic, we would expect that estimate to be close to the parameter, but not necessarily exactly equal to the unknown population parameter. How close would depend on how large a sample we took, who was sampled, how they were sampled and other factors. Hypothesis testing is a scientific method used to evaluate claims about population parameters.
A statistical hypothesis is an educated conjecture about a population parameter. This conjecture may or may not be true. We will take sample data and infer from the sample if there is evidence to support our claim about the unknown population parameter.
The null hypothesis (H0, pronounced “H-naught” or “H-zero”), is a statistical hypothesis that states that there is no difference between a parameter and a specific value, or that there is no difference between two parameters. The null hypothesis is assumed true until there is sufficient evidence otherwise.
The alternative hypothesis (H1 or Ha, pronounced “H-one” or “H-ā”), is a statistical hypothesis that states that there is a difference between a parameter and a specific value, or that there is a difference between two parameters. H1 is always the complement of H0.
The researcher decides the probability that the test is true by setting the level of significance, also called the significance level. We use the Greek letter α, pronounced “alpha,” to represent the significance level. The level of significance is the probability that the null hypothesis is rejected when it is actually true. Note: like in the previous chapter, 1 – is the confidence level.
When doing your own research, you should set up their hypotheses and choose the significance level before analyzing the sample data.
When reading a word problem, your first step is to identify the parameter(s), for example μ, you are testing and which direction (left, right, or two-tail) test you are being asked to perform. For this course, the homework problems will state the researcher’s claim; usually this is the alternative hypothesis.
The null-hypothesis is always set up as a parameter equal to some value (called the test value) or equal to another parameter. The null hypothesis is assumed true unless there is strong evidence from the sample to suggest otherwise. Similar to our judicial system that a person is innocent until the prosecutor shows enough evidence that they are not innocent.
For example, an investment company wants to build a new food cart. They know from experience that food carts are successful if they have on average more than 100 people a day walk by the location. They have a potential site to build on, but before they begin, they want to see if they have enough foot traffic. They observe how many people walk by the site every day over a month. The investors want to be very careful about setting up in a bad location where the food cart will fail, rather than the missed opportunity build in a prime location. We have two hypotheses. For an average of more than 100 people, we would write this in symbols as μ > 100. This claim needs to go into the alternative hypothesis since there is no equality, just strictly greater than 100. The complement of greater than is μ ≤ 100. This has a form of equality (≤) so needs to go in the null hypothesis.
We then would set up the hypotheses as:
- H0: μ ≤ 100 (Do not build)
- H1: μ > 100 (Build).
When performing the hypothesis test, the test statistic assumes that the parameter is the null hypothesis equal to some value. This still implies that the parameter could be any value less than or equal to 100 but our hypothesis test should be written as:
- H0: μ = 100
- H1: μ > 100
Either notation is fine, but most textbooks will always have the = sign in the null hypothesis. The null hypothesis is based off historical value, a claim or product specification.
Signs are Important
When there is a greater than sign (>) in the alternative hypothesis, we call this a right-tailed test. If we had a less than sign (<) in the alternative hypothesis, then we would have a left-tailed test. If there were a not equal sign (≠) in the alternative hypothesis, we would have a two-tailed test. The tails will determine which side the critical region will fall on the sampling distribution. Note that you should never have an =, ≤ or ≥ sign appear in the alternative hypothesis.
- The null-hypothesis of a two-tailed test states that the mean μ is equal to some value μ0.
- The null-hypothesis of a right-tailed test implies that the mean μ is less than or equal to some value μ0.
- The null-hypothesis of a left-tailed test implies that the mean μ is greater than or equal to some value μ0.
Look for key phrases in the research question to help you set up the hypotheses. Make sure that the =, ≤ and ≥ sign always go in the null hypothesis. The ≠, > and < sign always go in the alternative hypothesis. Look for these phrases in Figure 8-1 to help you decide if you are setting up a two-tailed test (first column), a right-tailed test (second column), or left-tailed test (third column).
When you read a question, it is essential that you identify the parameter of interest. The parameter determines which distribution to use. Make sure that you can recognize and distinguish which parameter you are making a conjecture about: mean = µ, proportion = p, variance = σ2, standard deviation = σ. There will be more parameters in later chapters.
Do not use the sample statistics, like or , in the hypotheses. We are not making any inference about the sample statistics. We know the value of the sample statistic. We use the sample statistics to infer if a change has occurred in the population.
For example, if we were making a conjecture about the percent or proportion in a population we would have the hypotheses:
H0: p = p0
H1: p ≠ p0.
Setting up the hypotheses correctly is the most important step in hypothesis testing. Here are some example research questions and how to set up the null and alternative hypotheses correctly; in a later section, we will perform the entire hypothesis test.
Use Figure 8-1 as a guide in setting up your hypotheses. The first column shows the hypotheses and how to shade in the distribution for a two-tailed test, with common phrases in the claim. The two-tailed test will always have a not equal ≠ sign in the alternative hypothesis and both tails shaded. The second column is for a right-tailed test. Note that the greater than > sign always will be in the alternative hypothesis and the right tail is shaded. The third column is for a left-tailed test. The left-tailed test will always have a less than < sign in the alternative hypothesis and the left tail shaded in.
Hypothesis Testing Common Phrases
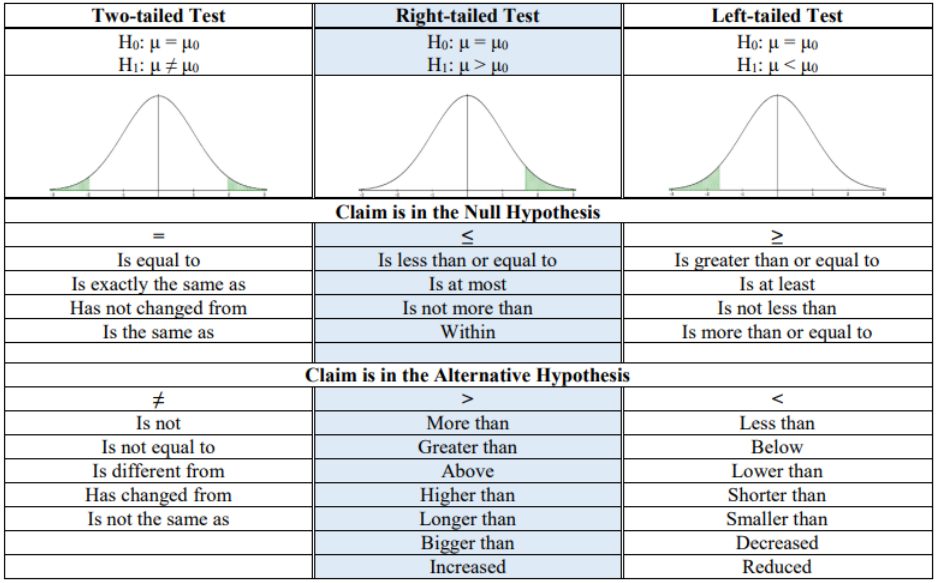
Figure 8-1
To understand the process of a hypothesis test, you need to first understand what a hypothesis is, which is an educated guess about a parameter. Once you have the alternative hypothesis, you collect data and use the data to decide to see if there is enough evidence to show that the alternative hypothesis is true. However, in hypothesis testing you actually assume something else is true, the null hypothesis, and then you look at your data to see how likely it is to get an event that your data demonstrates with that assumption. If the event is very unusual, then you might think that your assumption is actually false. If you are able to say this assumption is false, then your alternative hypothesis could be true. You assume the opposite of your alternative hypothesis is true and show that it cannot be true. If this happens, then your alternative hypothesis is probably true. All hypothesis tests go through the same process. Once you have the process down, then the concept is much easier.
When setting up your hypotheses make sure the parameter, not the statistic, is used in the hypotheses. The equality always goes in the null hypothesis H0 and the alternative hypothesis Ha will be a left-tailed test with a less than sign <, a two-tailed test with a not equal sign , or a right-tailed test with a greater than sign >.
“‘But alright,’ went on the rumblings, ‘so what's the alternative?’
‘Well,’ said Ford, brightly but slowly, ‘stop doing it of course!’”
(Adams, 2002)
Adapted from Mostly Harmless Statistics by Rachel Webb (Portland State University, https://mostlyharmlessstat.wixsite.com/webpage), © Rachel Webb, licensed under CC BY-SA 4.0. Changes were made. License: CC-BY-SA-4.0.