Suppose you want to estimate the population proportion, p. As an example, an administrator may want to know what proportion of students at your school smoke. An insurance company may want to know what proportion of accidents are caused by teenage drivers who do not have a drivers’ education class. Every time we collect data from a new sample, we would expect the estimate of the proportion to change slightly. If you were to find a range of values over an interval this would give a better estimate of where the population proportion falls. This range of values that would better predict the true population parameter is called an interval estimate or confidence interval.
The sample proportion is the point estimate for p, the standard error (the standard deviation of the sampling distribution) of is , the zα/2 is the critical value using the standard normal distribution, and the margin of error . Some textbooks use instead of p for the population proportion, and (pronounced “p-bar”) instead of for sample proportion.
This formula is derived from the normal approximation of the binomial distribution, therefore the same conditions for a binomial need to be met, namely a set sample size of independent trials, two outcomes that have the same probability for each trial.
Steps for Calculating a Confidence Interval
1. State the random variable and the parameter in words.
x = number of successes
p = proportion of successes
2. State and check the assumptions for confidence interval.
a. A simple random sample of size n is taken.
b. The conditions for the binomial distribution are satisfied.
c. To determine the sampling distribution of , you need to show that , where = 1 − . If this requirement is true, then the sampling distribution of is well approximated by a normal curve. (In reality, this is not really true, since the correct assumption deals with p. However, in a confidence interval you do not know p, so you must use . This means you just need to show that x ≥ 10 and n – x ≥ 10.)
3. Compute the sample statistic and the confidence interval .
4. Statistical Interpretation: In general, this looks like:
“We can be (1 – α)*100% confident that the interval
Real World Interpretation: This is where you state what interval contains the true proportion.
Using Technology
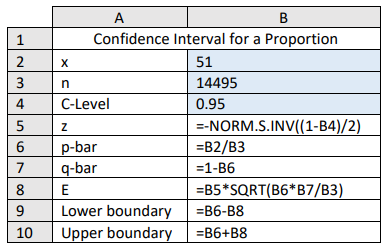
Excel has no built-in shortcut key for finding a confidence interval for a proportion, but if you type in the following formulas shown below you can make your own Excel calculator where you just change the highlighted cells and all the numbers below will update with the relevant information.
Type in the following be cognizant of cell reference numbers.
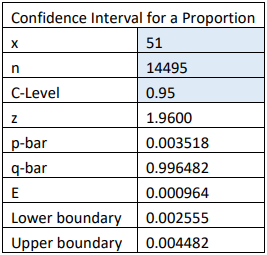
You get the following answers where the last two numbers are your confidence interval limits.
Make sure to put your answer in interval notation (0.002555, 0.004482) or 0.26% < p < 0.45%.
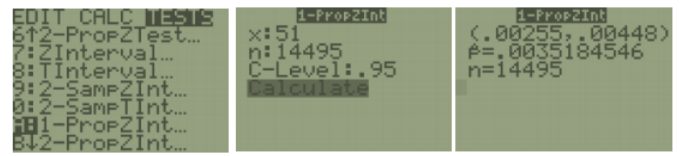
You can also do the calculations for the confidence interval with the TI Calculator.
TI-84: Press the [STAT] key, arrow over to the [TESTS] menu, arrow down to the [A:1-PropZInterval] option and press the [ENTER] key. Then type in the values for x, sample size and confidence level, arrow down to [Calculate] and press the [ENTER] key. The calculator returns the answer in interval notation. Note: Sometimes you are not given the x value but a percentage instead. To find the x to use in the calculator, multiply by the sample size and round off to the nearest integer. The calculator will give you an error message if you put in a decimal for x or n. For example, if = 0.22 and n = 124 then 0.22*124 = 27.28, so use x = 27.
TI-89: Go to the [Apps] Stat/List Editor, then press [2nd] then F7 [Ints], then select 5: 1-PropZInt. Type in the values for x, sample size and confidence level, and press the [ENTER] key. The calculator returns the answer in interval notation. Note: sometimes you are not given the x value but a percentage instead. To find the x value to use in the calculator, multiply by the sample size and round off to the nearest integer. The calculator will give you an error message if you put in a decimal for x or n. For example, if = 0.22 and n = 124 then 0.22*124 = 27.28, so use x = 27.
These eBooks are a prerelease and are not yet certified conformant with WCAG 2.1 AA or ADA Title II. Every page is built against an automated accessibility gate, and the published editions will meet ADA Title II requirements when they release in late September 2026. If something is unusable, please tell us.