
6.2 Uniform Distribution
The continuous uniform distribution models the probability that is the same on an interval from a to b. We use the following probability density function (PDF) to graph a straight line.
The probability is found by taking the area between two points within the rectangle formed from the x-axis, between the endpoints a and b, the length, and f(x) = 1/(b-a), the height. When working with continuous distributions it is helpful to draw a picture of the distribution, then shade in the area of the probability that you are trying to find. See Figure 6-5.
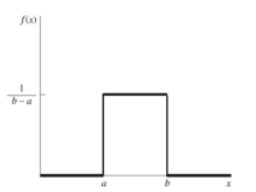
Figure 6-5
If a continuous random variable X has a uniform distribution with starting point a and ending point b then the distribution is denoted as X~U(a,b).
Adapted from Mostly Harmless Statistics by Rachel Webb (Portland State University, https://mostlyharmlessstat.wixsite.com/webpage), © Rachel Webb, licensed under CC BY-SA 4.0. Changes were made. License: CC-BY-SA-4.0.