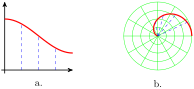
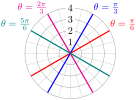
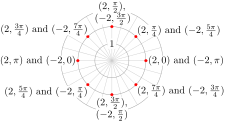
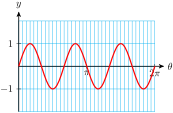
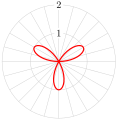
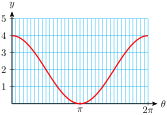
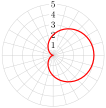
When we plot points in Cartesian coordinates, we start at the origin and move a distance right or left given by the -coordinate of the point, then move up or down according to the -coordinate. When we sketch the graph of an equation or function, we think of drawing the graph from left to right, with the "height" of the graph at each -value given by the function, as shown in figure (a).
In polar coordinates, however, the dependent variable, , gives not a height but a distance from the pole in direction , as shown in figure (b). When graphing an equation in polar coordinates, we think of sweeping around the pole in the counterclockwise direction, and at each angle the -value tells us how far the graph is from the pole.
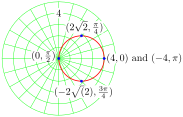
To prove that the graph in the previous Example is really a circle, we convert the equation to Cartesian form. First, multiply both sides by to obtain
Next, replace by and by , to get
This equation is quadratic in two variables, so its graph is a conic section. We put the equation in standard form by completing the square in .
We have the equation of a circle with center and radius .
Graph the polar equation .
Using a Graphing Calculator
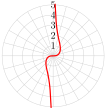
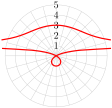
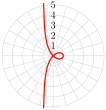
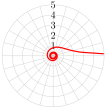
You are familiar with the graphs of many equations in Cartesian coordinates, including lines, parabolas and other conic sections, and the graphs of basic functions. You should now become familiar with some standard graphs in polar coordinates. These include circles and roses, cardioids and limaçons, lemniscates, and spirals.
At the end of this section you will find a Catalog of the basic polar graphs and their properties. You can use your calculator, set in Polar mode, to experiment with these graphs.
Use a calculator to graph the polar equation . Use the window settings
It is important to connect the points on the graph in order of increasing .
Use your calculator to graph the polar equation .
Complete the table of values for the function.
Sketch the graph by hand on the grid at right.
Sketching Familiar Equations
You should also be able to sketch the standard polar graphs by hand. Once you recognize an equation as a particular type of graph, say a rose or a limaçon, you can sketch the graph quickly by finding just a few well-chosen guidepoints. The next example demonstrates a technique for sketching a rose.
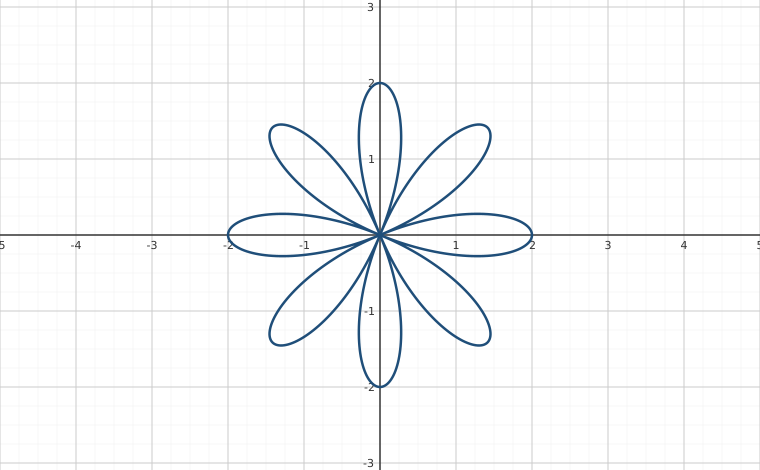
Interactive figureRoses: r = a cos(nθ) and the petal countDrag the Petal length a and Petal number n sliders.
XYZ Graph · viewer build 5edf91b
The rose family r = a cos(nθ), live. The slider a sets the petal length — each petal reaches out to distance a from the pole. The slider n sets the petal count, and it follows the section's rule exactly: an odd n gives n petals, an even n gives 2n. Step n from 3 to 4 and watch the count jump from three petals to eight — with n odd the curve traces each petal twice as θ runs from 0 to 2π, so half the petals coincide, while with n even all 2n petals are distinct. At n = 1 the “rose” has a single petal: a circle of diameter a through the pole, the standard circle graph from earlier in this section.
Graph the polar equation .
The limaçons, and , are another family of polar graphs. In particular, the cardioid is a special case of a limaçon with .
Graph the polar equation .
You should also be able to identify a polar graph and write its equation.
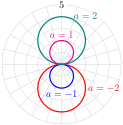
Give a polar equation for each of the graphs below.
Finding Intersection Points
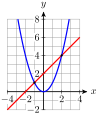
To find the intersection points of two graphs, we solve the system made up of their equations. If the equations are and , we simply solve the equation . For example, we find the intersection points of and by solving the equation to get
These are the -coordinates of the intersection points, and we can find the -coordinates by substituting these values into either equation.
For we find
For we find
Thus, the intersection points are and , as shown at right.
To find the intersection points of the polar graphs and we solve the equation .
Find all intersection points of the graphs of and , for .
,
Review the following skills you will need for this section.
A Catalog of Polar Curves
The Coordinate Curves
( a constant)
A line through the pole.
gives the angle of inclination of the line (in radians).
( a constant)
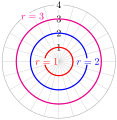
A circle centered at the pole.
is the radius of the circle.
Circles
A circle with center on the -axis, and radius .
A circle with center on the -axis, and radius .
Roses
A rose with petal length .
petals if is odd; petals if is even.
A rose with petal length .
petals if is odd; petals if is even.
Limaçons
or
, with a dent.
, with a loop.
, a cardioid.
Lemniscates
Spirals
Archimedean spiral
Logarithmic spiral
Section 10.2 Summary
Vocabulary
Rose
Limaçon
Cardioid
Lemniscate
Concepts
When graphing an equation in polar coordinates, we think of sweeping around the pole in the counterclockwise direction, and at each angle the -value tells us how far the graph is from the pole.
Standard graphs in polar coordinates include circles and roses, cardioids and limaçons, lemniscates, and spirals.
To find the intersection points of the polar graphs and we solve the equation . In addition, we should always check whether the pole is a point on both graphs.
Study Questions
Delbert says that the graph of in the first example cannot be correct, because there are no points on the graph for angles between and . How do you respond?
Is it possible to have a rose with only two petals? What would its equation be?
Francine says that a circle of the form is just a special case of a limaçon. Support or refute her statement.
There are no points on the graph of for angles between and Why is that?
Skills
Describe the effect of parameters in polar curves #1–16, 83–84
Compare polar and Cartesian graphs #21–24
Sketch standard polar graphs #17–20, 25–42, 75–82
Identify standard polar graphs #43–58
Write equations for standard polar graphs #59–66
Find intersection points of polar graphs #67–74
Homework 10-2
In Problems 1-4, use graphing technology to graph the equations.
Graph , for . How does the graph change for different values of ?
Write a Cartesian equation for each graph in part (a).
is the radius
Graph , for . How does these graphs compare to the graphs in Problem 1?
Write a Cartesian equation for each graph in part (a).
Graph , for . How does the graph change for different values of ?
Write a Cartesian equation for each graph in part (a).
is the slope
Graph , for . How does the graph change for different values of ?
Write a Cartesian equation for each graph in part (a).
Complete the table of values for each equation. Plot the points in order of increasing . What is different about the two graphs?
Equation 1:
Equation 2:
The graph of begins at the right-most point (and proceeds counter-clockwise); the graph of begins at the left-most point.
Graph each line, and label the points with their coordinates. How are the points on the two lines related?
Equation 1:
Equation 1:
Graph the circle . Label the points corresponding to and .
Complete the table of values. What happens to the graph as increases from to ?
Find the center and radius of the circle.
Give the Cartesian equation of the circle.
The graph is traced again.
center: , radius:
Graph the circle . Label the points corresponding to and .
Complete the table of values. What happens to the graph as increases from to ?
Find the center and radius of the circle.
Give the Cartesian equation of the circle.
Graph for .
How do the graphs change for different values of ?
For , is the radius of a circle centered on the positive -axis; for , is the radius of a circle centerd on the negative -axis.
Graph for .
How do the graphs change for different values of ?
Complete the table of values for each cardioid, and graph the equation.
Complete the table of values for each cardioid, and graph the equation.
Complete the table of values for each limaçon, and graph the equation.
Complete the table of values for each limaçon, and graph the equation.
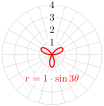
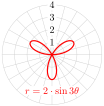
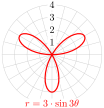
Graph the following roses and compare. How is the number of petals related to the value of in the equation ?
For each graph above, list the values of where the tips of the petals occur.
Graph for and . How does the value of affect the graph?
There are petals if is odd, and petals if is even.
is the length of the petal.
Graph the following roses and compare. How is the number of petals related to the value of in the equation ?
For each graph above, list the values of where the tips of the petals occur.
Graph for and . How does the value of affect the graph?
Solve for . (You should get two equations for .)
Graph both equations together. Change step to 0.02 to see the whole graph.
How does the value of affect the graph of ?
is the length of the loop.
Solve for . (You should get two equations for .)
Graph both equations together. Change step to 0.02 to see the whole graph.
How does this graph differ from the graph in Problem 17?
Graph the Archimedean spiral . Set your window to
Then graph by pressing Zoom 5.
Graph the logarithmic spiral . Set your window to
Then graph by pressing Zoom 5.
Complete the table and graph the equation in Cartesian coordinates, for .
Complete the table and graph the equation in polar coordinates, for .
Complete the table and graph the equation in Cartesian coordinates, for .
Complete the table and graph the equation in polar coordinates, for .
Complete the table and graph the equation in Cartesian coordinates, for .
Complete the table and graph the equation in polar coordinates, for .
Complete the table and graph the equation in Cartesian coordinates, for .
Complete the table and graph the equation in polar coordinates, for .
For Problems 25–42, use the catalog of polar graphs to help you identify and sketch the following curves. Check your work by graphing with a graphing utility.
circle
line
circle
cardioid
limaçon
rose
rose
limaçon
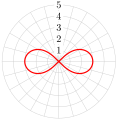
lemniscate
For Problems 43–52, identify each curve, and graph it.
circle
arcs of a circle
semicircle
rose
cardioid
For Problems 53–58, graph the following polar curves. Do you recognize them?
parabola
ellipse
hyperbola
For Problems 59–66, write a polar equation for the graph.
For Problems 67–74, find the coordinates of the intersection points of the two curves analytically. Then graph the curves to verify your answers.
,,
, ,
,
,
For Problems 75–82, graph the polar curve.
(conchoid)
(kappa curve)
(strophoid)
(cissoid)
Graph the polar curves for . Explain how the value of the parameter affects the curve.
The curve has large loops and small loops.
Graph the polar curves for . Explain how the value of the parameter affects the curve.
Trigonometry by Katherine Yoshiwara (yoshiwarabooks.org), GNU Free Documentation License 1.2 or later. Adapted for the XYZ HTML edition with the authors' permission (recorded 2026-07-04). License: GFDL-1.2-or-later.
These eBooks are a prerelease and are not yet certified conformant with WCAG 2.1 AA or ADA Title II. Every page is built against an automated accessibility gate, and the published editions will meet ADA Title II requirements when they release in late September 2026. If something is unusable, please tell us.