
Login
📚 Mostly Harmless Statistics
Chapters ▾
⇩ Download ▾

9.6 Chapter 9 Formulas

Hypothesis Test for 2 Dependent Means H0:μD=0 H1:μD0 t=D¯μD(SDn) TI-84: T-Test Confidence Interval for 2 Dependent Means D¯±tα/2(sDn) TI-84: TInterval
Hypothesis Test for 2 Independent Means Z-Test: \(\begin{aligned}
\mathrm{H}_{0}: \mu_{1} &=\mu_{2} \\
\mathrm{H}_{1}: \mu_{1} & \neq \mu_{2}
\end{aligned}\) z=(x¯1x¯2)(μ1μ2)0(σ12n1+σ22n2) TI-84: 2-SampZTest
Confidence Interval for 2 Independent Means Z-Interval
\(\left(\bar{x}_{1}-\bar{x}_{2}\right) \pm z_{\alpha / 2} \sqrt{\left(\frac{\sigma_{1}^{2}}{n_{1}}+\frac{\sigma_{2}^{2}}{n_{2}}\right)}
\)
TI-84: 2-SampZInt
Hypothesis Test for 2 Independent Means \(\begin{aligned}
&\mathrm{H}_{0}: \mu_{1}=\mu_{2} \\
&\mathrm{H}_{1}: \mu_{1} \neq \mu_{2}
\end{aligned}\) T-Test: Assume variances are unequal t=(x¯1x¯2)(μ1μ2)0(s12n1+s22n2) TI-84: 2-SampTTest df=(s12n1+s22n2)2((s12n1)2(1n11)+(s22n2)2(1n21)) T-Test: Assume variances are equal \(\begin{aligned}
&t=\frac{\left(\bar{x}_{1}-\bar{x}_{2}\right)-\left(\mu_{1}-\mu_{2}\right)}{\sqrt{\left(\frac{\left(n_{1}-1\right) s_{1}^{2}+\left(n_{2}-1\right) s_{2}^{2}}{\left(n_{1}+n_{2}-2\right)}\right)\left(\frac{1}{n_{1}}+\frac{1}{n_{2}}\right)}} \\
&d f=\mathrm{n}_{1}-\mathrm{n}_{2}-2
\end{aligned}\)
Confidence Interval for 2 Independent Means (x¯1x¯2)±tα/2(s12n1+s22n2) TI-84: 2-SampTInt df=(s12n1+s22n2)2((s12n1)2(1n11)+(s22n2)2(1n21)) T-Interval: Assume variances are equal \(\begin{aligned}
&\left(\bar{x}_{1}-\bar{x}_{2}\right) \pm t_{\alpha / 2} \sqrt{\left(\left(\frac{\left(n_{1}-1\right) s_{1}^{2}+\left(n_{2}-1\right) s_{2}^{2}}{\left(n_{1}+n_{2}-2\right)}\right)\left(\frac{1}{n_{1}}+\frac{1}{n_{2}}\right)\right)} \\
&d f=\mathrm{n}_{1}-\mathrm{n}_{2}-2
\end{aligned}\)
Hypothesis Test for 2 Proportions \(\begin{aligned}
&\mathrm{H}_{0}: p_{1}=p_{2} \\
&\mathrm{H}_{1}: p_{1} \neq p_{2}
\end{aligned}\) Z=(p^1p^2)(p1p2)(p^·q^(1n1+1n2)) p^=(x1+x2)(n1+n2)=(p^1·n1+p^2·n2)(n1+n2) q^=1p^p^1=x1n1p^2=x2n2 TI-84: 2-PropZInt
Confidence Interval for 2 Proportions (p^1p^2)±zα2(p^1q^1n1+p^2q^2n2) p^1=x1n1p^2=x2n2 q^1=1p^1q^2=1p^2 TI-84: 2-PropZInt
Hypothesis Test for 2 Variances \(\begin{aligned}
&H_{0}: \sigma_{1}^{2}=\sigma_{2}^{2} \\
&H_{1}: \sigma_{1}^{2} \neq \sigma_{2}^{2}
\end{aligned} \quad F=\frac{s_{1}^{2}}{s_{2}^{2}}\) df N=n11,dfD=n21 TI-84: 2-SampFTest
Hypothesis Test for 2 Standard Deviations \(\begin{aligned}
&H_{0}: \sigma_{1}=\sigma_{2} \\
&H_{1}: \sigma_{1} \neq \sigma_{2}
\end{aligned} \quad F=\frac{s_{1}^{2}}{s_{2}^{2}}\) df N=n11,dfD=n21 TI-84: 2-SampFTest

The following flow chart in Figure 9-18 can help you decide which formula to use. Start on the left, ask yourself is the question about proportions (%), means (averages), standard deviations or variances? Are there 1 or 2 samples? Was the population standard deviation given? Are the samples dependent or independent? Are you asked to test a claim? If yes then use the test statistic (TS) formula. Are you asked to find a confidence interval? If yes then use the confidence interval (CI) formula. In each box is the null hypothesis and the corresponding TI calculator shortcut key.
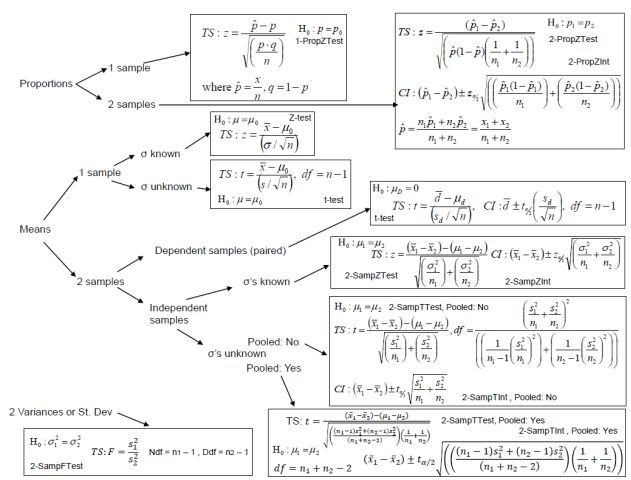
Decision flowchart for choosing a hypothesis test, each box giving the null hypothesis, test statistic and confidence interval formulas, and the TI calculator command. Proportions: one sample uses 1-PropZTest, two samples use 2-PropZTest or 2-PropZInt with a pooled proportion. Means: one sample uses the Z-test when σ is known or the t-test with df = n - 1 when unknown; dependent (paired) samples use a t-test on the differences with df = n - 1; independent samples use 2-SampZTest when σ's are known, otherwise 2-SampTTest or 2-SampTInt with pooled (df = n1 + n2 - 2) or unpooled df formulas. Two variances or standard deviations: 2-SampFTest with F = s1²/s2², Ndf = n1 - 1, Ddf = n2 - 1.

Figure 9-18

Download a.pdf version of the flowchart at: http://MostlyHarmlessStatistics.com.

The same steps are used in hypothesis testing for a one sample test. Use technology to find the p-value or critical value. A clue with many of these questions of whether the samples are dependent is the term “paired” is used, or the same person was being measured before and after some applied experiment or treatment. The p-value will always be a positive number between 0 and 1.

Adapted from Mostly Harmless Statistics by Rachel Webb (Portland State University), hosted on LibreTexts (stats.libretexts.org) and licensed under CC BY-SA 4.0. Changes were made. License: CC-BY-SA-4.0.