9.3 Two Proportion Z-Test and Confidence Interval
This section will look at how to analyze a difference in the proportions for two independent samples. As with all other hypothesis tests and confidence intervals, the process of testing is the same, though the formulas and assumptions are different.
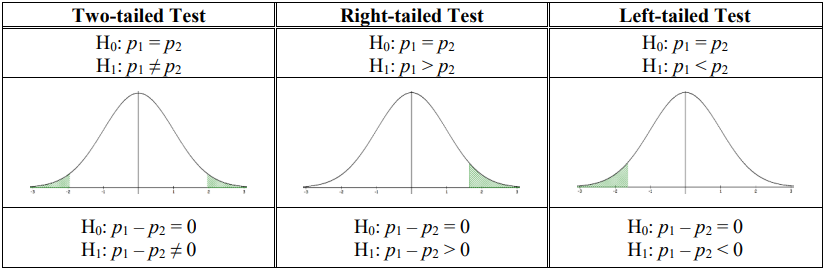
There are three types of hypothesis tests for comparing the difference in 2 population proportions p1 – p2, see Figure 9-7.

Note that for our purposes, p1 – p2 = 0. We could also use a variant of this model to test for a magnitude difference for when p1 – p2 ≠ 0, but we will not cover that scenario.
The pooled proportion is a weighted mean of the proportions and is the complement of . Some texts or software may use different notation for the pooled proportion, note that .
Two Proportions Z-Interval
Definition
A 100(1 – )% confidence interval for the difference between two population proportions p1 – p2:
Or more compactly as
The requirements are identical to the 2-proportion hypothesis test. Note that the standard error does not rely on a hypothesized proportion so do not use a confidence interval to make decisions based on a hypothesis statement.
Example 2
Find the 95% confidence interval for the difference in the proportion of late students in their first class and the proportion who are late to their class after lunch.
First Class
After Lunch Class
Sample Size 200 200 Number of late students 13 16
Show solution
First, compute the following:
Find the critical value. Use the inverse normal to get = 1.96.
Now substitute the numbers into the interval estimate:
\(\begin{aligned}
&\Rightarrow(0.065-0.08) \pm 1.96 \sqrt{\left(\frac{0.065 \cdot 0.935}{200}+\frac{0.08 \cdot 0.92}{200}\right)} \\
&\Rightarrow \quad-0.015 \pm 0.0508 \\
&\Rightarrow \quad(-0.0508,0.0358).
\end{aligned}\)
Use interval notation (–0.0508, 0.0358) or standard notation –0.0508 < p1 – p2 < 0.0358. Note that we can have negative numbers here since we are taking the difference of two proportions.
Since p1 – p2 = 0 is in the interval, we are 95% confident that there is no difference in the proportion of late students between their first class or those who are late for their class after lunch.
TI-84: Press the [STAT] key, arrow over to the [TESTS] menu, arrow down to the option [2-PropZInterval] and press the [ENTER] key. Type in the x1, n1, x2, n2, the confidence level, then press the [ENTER] key, arrow down to [Calculate] and press the [ENTER] key. The calculator returns the confidence interval.

TI-89: Go to the [Apps] Stat/List Editor, then press [2nd] then F7 [Ints], then select 6: 2-PropZInt. Type in the x1, n1, x2, n2, the confidence level, then press the [ENTER] key to calculate. The calculator returns the confidence interval.
Adapted from Mostly Harmless Statistics by Rachel Webb (Portland State University), hosted on LibreTexts (stats.libretexts.org) and licensed under CC BY-SA 4.0. Changes were made. License: CC-BY-SA-4.0.