

6.5 Interpreting Slope and y-Intercept
Interpreting Slope and y-Intercept
A source-bound narrated opening with a worked example, an eight-second thinking pause, a checked result, English captions, and a transcript.
Read the transcriptDownload the videoNarration credits and licences
Identify the Slope and y-Intercept From an Equation of a Line
We can graph a line using the slope and a point. When we are given an equation in slope–intercept form, we can use the y-intercept as the point, and then count out the slope from there. Let’s practice finding the values of the slope and y-intercept from the equation of a line.
When an equation of a line is not given in slope–intercept form, our first step will be to solve the equation for .
Graph and Interpret Applications of Slope–Intercept
Many real-world applications are modeled by linear equations. We will take a look at a few applications here so you can see how equations written in slope–intercept form relate to real-world situations.
Usually when a linear equation models a real-world situation, different letters are used for the variables, instead of x and y. The variable names remind us of what quantities are being measured.
The cost of running some types of business has two components—a fixed cost and a variable cost. The fixed cost is always the same regardless of how many units are produced. This is the cost of rent, insurance, equipment, advertising, and other items that must be paid regularly. The variable cost depends on the number of units produced. It is for the material and labor needed to produce each item.
Practice Makes Perfect
Identify the Slope and y-Intercept From an Equation of a Line
In the following exercises, identify the slope and y-intercept of each line.
Show solution
Show solution
Show solution
Show solution
Show solution
Graph and Interpret Applications of Slope–Intercept
The equation models the relation between the amount of Tuyet’s monthly water bill payment, P, in dollars, and the number of units of water, w, used.
- ⓐ Find Tuyet’s payment for a month when 0 units of water are used.
- ⓑ Find Tuyet’s payment for a month when 12 units of water are used.
- ⓒ Interpret the slope and P-intercept of the equation.
- ⓓ Graph the equation.
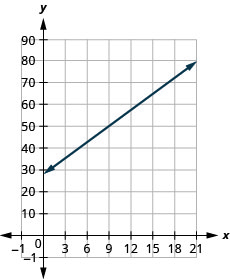
The equation models the relation between the amount of Randy’s monthly water bill payment, P, in dollars, and the number of units of water, w, used.
- ⓐ Find the payment for a month when Randy used 0 units of water.
- ⓑ Find the payment for a month when Randy used 15 units of water.
- ⓒ Interpret the slope and P-intercept of the equation.
- ⓓ Graph the equation.
Show solution
- ⓐ $28
- ⓑ $66.10
- ⓒ The slope, 2.54, means that Randy’s payment, P, increases by $2.54 when the number of units of water he used, w, increases by 1. The P–intercept means that if the number units of water Randy used was 0, the payment would be $28.
- ⓓ
Bruce drives his car for his job. The equation models the relation between the amount in dollars, R, that he is reimbursed and the number of miles, m, he drives in one day.
- ⓐ Find the amount Bruce is reimbursed on a day when he drives 0 miles.
- ⓑ Find the amount Bruce is reimbursed on a day when he drives 220 miles.
- ⓒ Interpret the slope and R-intercept of the equation.
- ⓓ Graph the equation.
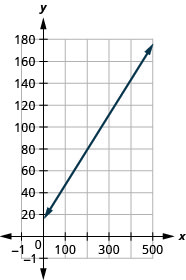
Janelle is planning to rent a car while on vacation. The equation models the relation between the cost in dollars, C, per day and the number of miles, m, she drives in one day.
- ⓐ Find the cost if Janelle drives the car 0 miles one day.
- ⓑ Find the cost on a day when Janelle drives the car 400 miles.
- ⓒ Interpret the slope and C–intercept of the equation.
- ⓓ Graph the equation.
Show solution
- ⓐ $15
- ⓑ $143
- ⓒ The slope, 0.32, means that the cost, C, increases by $0.32 when the number of miles driven, m, increases by 1. The C-intercept means that if Janelle drives 0 miles one day, the cost would be $15.
- ⓓ
Cherie works in retail and her weekly salary includes commission for the amount she sells. The equation models the relation between her weekly salary, S, in dollars and the amount of her sales, c, in dollars.
- ⓐ Find Cherie’s salary for a week when her sales were 0.
- ⓑ Find Cherie’s salary for a week when her sales were 3600.
- ⓒ Interpret the slope and S–intercept of the equation.
- ⓓ Graph the equation.
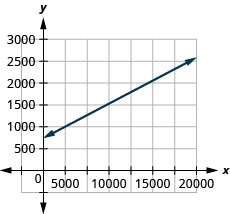
Patel’s weekly salary includes a base pay plus commission on his sales. The equation models the relation between his weekly salary, S, in dollars and the amount of his sales, c, in dollars.
- ⓐ Find Patel’s salary for a week when his sales were 0.
- ⓑ Find Patel’s salary for a week when his sales were 18,540.
- ⓒ Interpret the slope and S-intercept of the equation.
- ⓓ Graph the equation.
Show solution
- ⓐ $750
- ⓑ $2418.60
- ⓒ The slope, 0.09, means that Patel’s salary, S, increases by $0.09 for every $1 increase in his sales. The S-intercept means that when his sales are $0, his salary is $750.
- ⓓ
Costa is planning a lunch banquet. The equation models the relation between the cost in dollars, C, of the banquet and the number of guests, g.
- ⓐ Find the cost if the number of guests is 40.
- ⓑ Find the cost if the number of guests is 80.
- ⓒ Interpret the slope and C-intercept of the equation.
- ⓓ Graph the equation.
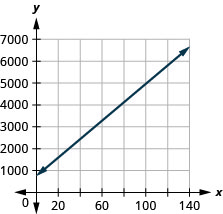
Margie is planning a dinner banquet. The equation models the relation between the cost in dollars, C of the banquet and the number of guests, g.
- ⓐ Find the cost if the number of guests is 50.
- ⓑ Find the cost if the number of guests is 100.
- ⓒ Interpret the slope and C–intercept of the equation.
- ⓓ Graph the equation.
Show solution
- ⓐ $2850
- ⓑ $4950
- ⓒ The slope, 42, means that the cost, C, increases by $42 when the number of guests increases by 1. The C-intercept means that when the number of guests is 0, the cost would be $750.
- ⓓ
Corequisite Skills for Introductory Statistics is a custom course edition compiled for Introductory Statistics corequisite courses from OpenStax Contemporary Mathematics, Elementary Algebra 2e, Intermediate Algebra 2e, Prealgebra 2e. Content by OpenStax is reproduced as published, apart from any corrections recorded for this edition. Sections are renumbered to follow the course outline. The course outline is adapted from Larry Green's Support Course for Elementary Statistics (LibreTexts, https://stats.libretexts.org/Bookshelves/Introductory_Statistics/Support_Course_for_Elementary_Statistics), used under CC BY 4.0 (https://creativecommons.org/licenses/by/4.0/). Lessons 2.4 and 6.7 are written for this edition by XYZ Homework. Every OpenStax lesson is abridged to the subsections and practice exercises this course uses. Lessons are headed with their course titles, not the source section titles. Access the complete originals free at openstax.org. License: CC-BY-NC-SA-4.0.