Corequisite Skills for Introductory StatisticsXYZ Homework Edition

6.4 Slope of a Line

Slope of a Line

A source-bound narrated opening with a worked example, an eight-second thinking pause, a checked result, English captions, and a transcript.

When you graph linear equations, you may notice that some lines tilt up as they go from left to right and some lines tilt down. Some lines are very steep and some lines are flatter. What determines whether a line tilts up or down or if it is steep or flat?

In mathematics, the ‘tilt’ of a line is called the slope of the line. The concept of slope has many applications in the real world. The pitch of a roof, grade of a highway, and a ramp for a wheelchair are some examples where you literally see slopes. And when you ride a bicycle, you feel the slope as you pump uphill or coast downhill.

In this section, we will explore the concept of slope.

Use Geoboards to Model Slope

A geoboard is a board with a grid of pegs on it. Using rubber bands on a geoboard gives us a concrete way to model lines on a coordinate grid. By stretching a rubber band between two pegs on a geoboard, we can discover how to find the slope of a line.
Interactive figureStretch a rubber band between two pegsDrag the 4 sliders below the figure.
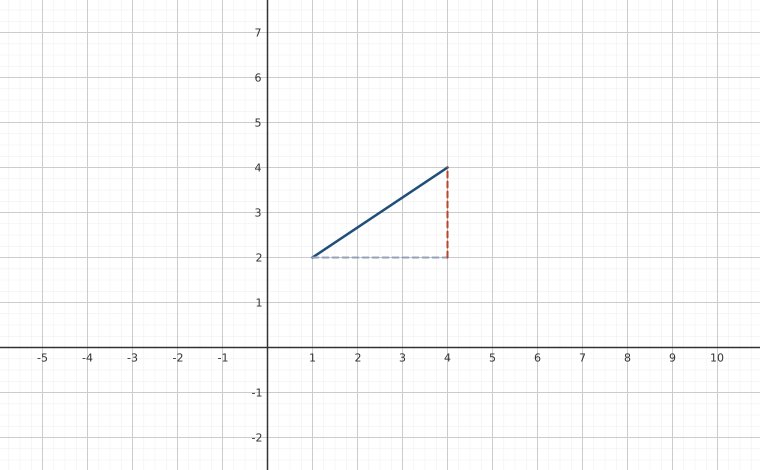
A rubber band stretches between two pegs, from peg (1, 2) up to peg (4, 4). A dashed gray run leg goes 3 units right from (1, 2) to (4, 2), and a dashed red rise leg goes 2 units up from (4, 2) to (4, 4): slope = rise over run = 2/3. Adjustable parameters: Peg 1 across (x1) = 1, Peg 1 up (y1) = 2, Peg 2 across (x2) = 4, Peg 2 up (y2) = 4. Drag either peg to a new spot. The dashed legs show the run (gray) and the rise (red); slope = rise over run. Viewing window: x from -5.94 to 10.94, y from -2.72 to 7.72.
XYZ Graph · viewer build 5edf91b
A rubber band stretched between two pegs models a line. It starts at the book's example — from peg (1, 2) up to peg (4, 4): a run of 3 and a rise of 2, so the slope is m = rise/run = 2/3. Drag either peg to model a different line; the dashed gray leg is the run and the dashed red leg is the rise.

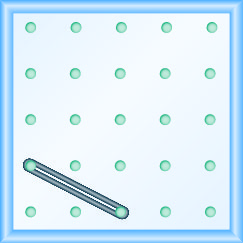
We’ll start by stretching a rubber band between two pegs as shown in Figure 6.11.
Interactive figureModeling Slope on a GeoboardDrag inside the figure to pan; scroll to zoom.
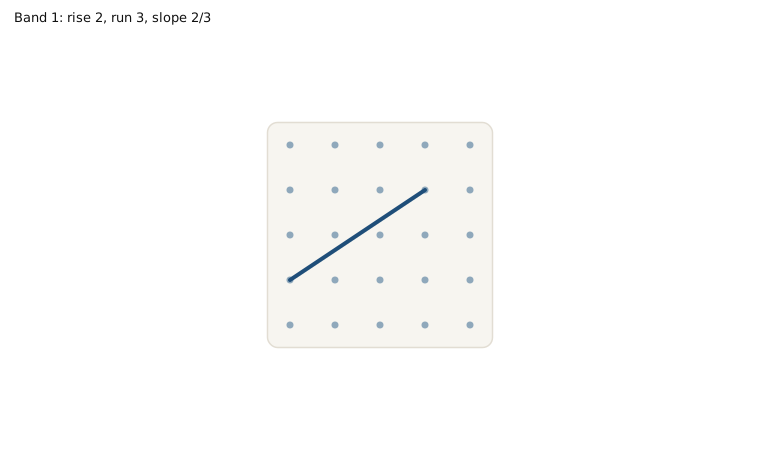
A 5-by-5 geoboard shows a rubber band stretched between the peg in column 1, row 4 and the peg in column 4, row 2. The resulting line has a slope of 2/3. The ends of the band are draggable, and a readout displays the current slope. Viewing window: x from -6.44 to 10.44, y from -3.22 to 7.22.
XYZ Graph · viewer build 5edf91b
The rubber band stretches from the peg at column 1, row 4 to the peg at column 4, row 2. This creates a right triangle with a vertical rise of 2 units and a horizontal run of 3 units, giving a slope of m = 2/3. Drag the endpoints to different pegs to see how the rise and run change the steepness of the line.
The figure shows a grid of evenly spaced pegs. There are 5 columns and 5 rows of pegs. A rubber band is stretched between the peg in column 1, row 4 and the peg in column 4, row 2, forming a line.
Figure 6.11

Doesn’t it look like a line?

Now we stretch one part of the rubber band straight up from the left peg and around a third peg to make the sides of a right triangle, as shown in Figure 6.12
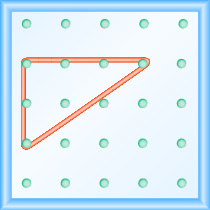
The figure shows a grid of evenly spaced pegs. There are 5 columns and 5 rows of pegs. A rubber band is stretched between the peg in column 1, row 2, the peg in column 1, row 4, and the peg in column 4, row 2, forming a right triangle. The 1, 2 peg is the vertex of the 90 degree angle, while the line between the 1, 4 and 4, 2 pegs forms the hypotenuse of the triangle.
Figure 6.12

We carefully make a 90º angle around the third peg, so one of the newly formed lines is vertical and the other is horizontal.

To find the slope of the line, we measure the distance along the vertical and horizontal sides of the triangle. The vertical distance is called the rise and the horizontal distance is called the run, as shown in Figure 6.13.
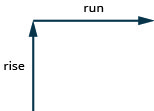
In this illustration, there are two perpendicular lines with arrows. The first line extends straight upward and is labeled “rise”. The second arrow extends straight rightward and is labeled “run”.
Figure 6.13

If our geoboard and rubber band look just like the one shown in Figure 6.14, the rise is 2. The rubber band goes up 2 units. (Each space is one unit.)
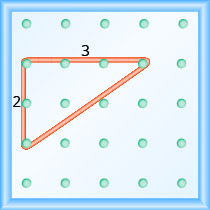
The figure shows a grid of evenly spaced pegs. There are 5 columns and 5 rows of pegs. A rubber band is stretched between the peg in column 1, row 2, the peg in column 1, row 4, and the peg in column 4, row 2, forming a right triangle where the 1, 2 peg is the vertex of the 90 degree angle and the line between the 1, 4 peg and the 4, 2 peg forms the hypotenuse. The line between the 1, 2 peg and the 1, 4 peg is labeled “2”. The line between the 1, 2 peg and the 4, 2 peg is labeled “3”.
Figure 6.14 The rise on this geoboard is 2, as the rubber band goes up two units.

What is the run?

The rubber band goes across 3 units. The run is 3 (see Figure 6.14).
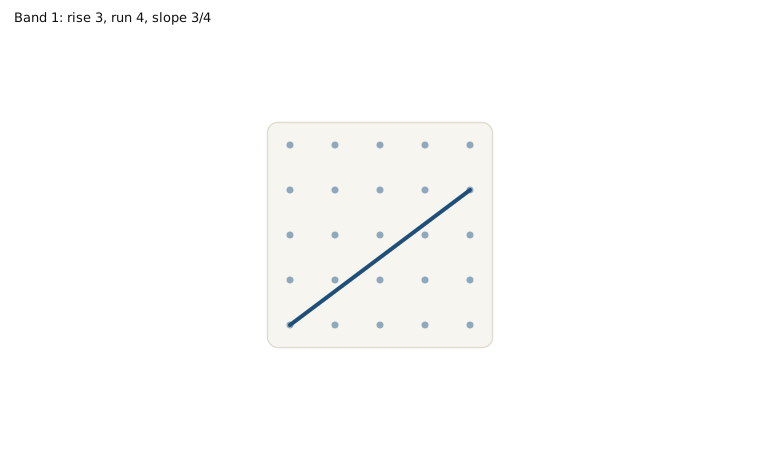
Interactive figureSlope on the geoboard: 3/4Drag inside the figure to pan; scroll to zoom.
Interactive geoboard with 5 rows and 5 columns of pegs. A rubber band is stretched between the peg in column 1, row 5 and the peg in column 5, row 2, forming a line with slope 3/4. Both ends of the band can be dragged to other pegs; a readout shows the current slope. Viewing window: x from -6.44 to 10.44, y from -3.22 to 7.22.
XYZ Graph · viewer build 5edf91b
The book's rubber band stretches from the peg in column 1, row 5 to the peg in column 5, row 2 — a rise of 3 over a run of 4, so the slope is 3/4. Drag either end of the band to new pegs and watch the rise, the run, and the slope readout change together.

The slope of a line is the ratio of the rise to the run. In mathematics, it is always referred to with the letter m.

What is the slope of the line on the geoboard in Figure 6.14?
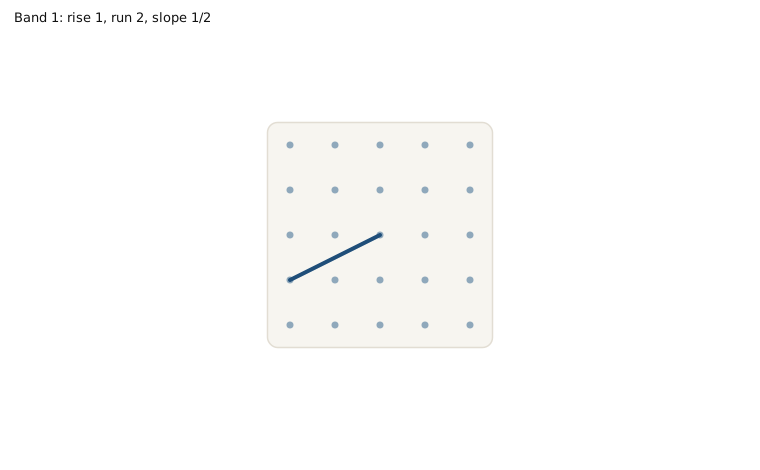
Interactive figureModel a line with slope 1/2Drag inside the figure to pan; scroll to zoom.
A 5-by-5 geoboard shows a rubber band stretched between the peg in column 1, row 4 and the peg in column 3, row 3. The resulting line has a slope of 1/2. The endpoints are draggable, and a readout displays the current slope. Viewing window: x from -6.44 to 10.44, y from -3.22 to 7.22.
XYZ Graph · viewer build 5edf91b
The rubber band stretches from (1, 4) along a run of 2 and a rise of 1 to (3, 3), creating a slope of m = 1/2. Drag the endpoints to change the rise and run while keeping the slope constant at 1/2. Watch how the dashed legs of the right triangle update to show the current vertical and horizontal changes.

m=riserunm=23

The line has slope 23. This means that the line rises 2 units for every 3 units of run.

When we work with geoboards, it is a good idea to get in the habit of starting at a peg on the left and connecting to a peg to the right. If the rise goes up it is positive and if it goes down it is negative. The run will go from left to right and be positive.
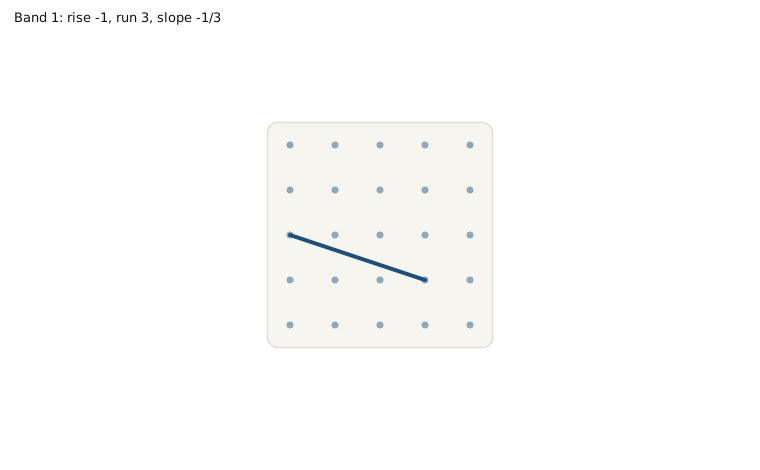
Interactive figureSlope on the geoboard: -1/3Drag inside the figure to pan; scroll to zoom.
Interactive geoboard with 5 rows and 5 columns of pegs. A rubber band is stretched between the peg in column 1, row 3 and the peg in column 4, row 4, forming a line with slope -1/3. Both ends of the band can be dragged to other pegs; a readout shows the current slope. Viewing window: x from -6.44 to 10.44, y from -3.22 to 7.22.
XYZ Graph · viewer build 5edf91b
The book's rubber band stretches from the peg in column 1, row 3 to the peg in column 4, row 4 — a rise of -1 over a run of 3, so the slope is -1/3. Drag either end of the band to new pegs and watch the rise, the run, and the slope readout change together.

Notice that in Example 1 the slope is positive and in Example 2 the slope is negative. Do you notice any difference in the two lines shown in Figure 6.15(a) and Figure 6.15(b)?
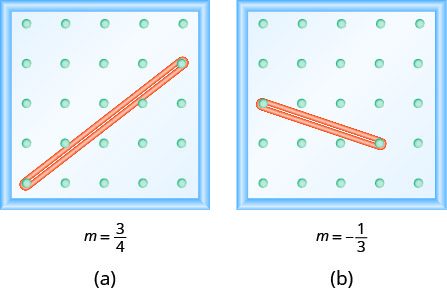
The figure shows two grids of evenly spaced pegs, one labeled (a) and one labeled (b). There are 5 columns and 5 rows of pegs in each grid. In the (a) grid, a rubber band is stretched between the peg in column 1, row 5 and the peg in column 5, row 2, forming a line. Below this grid is the slope of a line defined as m equals 3 fourths. In the (b) grid, a rubber band is stretched between the peg in column 1, row 3 and the peg in column 4, row 4, forming a line. Below this grid is the slope of a line defined as m equals negative 1 third.
Figure 6.15

We ‘read’ a line from left to right just like we read words in English. As you read from left to right, the line in Figure 6.15(a) is going up; it has positive slope. The line in Figure 6.15(b) is going down; it has negative slope.
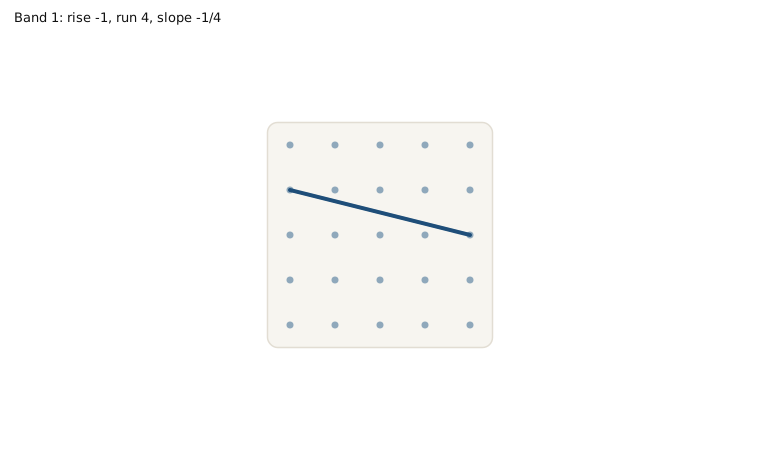
Interactive figureModel a line with slope -1/4Drag inside the figure to pan; scroll to zoom.
A 5-by-5 geoboard shows a rubber band stretched from the peg in column 1, row 2 to the peg in column 5, row 3. The resulting line has a slope of -1/4. The endpoints are draggable, and a readout displays the current slope. Viewing window: x from -6.44 to 10.44, y from -3.22 to 7.22.
XYZ Graph · viewer build 5edf91b
The geoboard rubber band stretches from (1, 2) along a run of 4 and a rise of -1 to the peg at (5, 3). This creates a slope of m = rise/run = -1/4. Drag the endpoints to see how changing the vertical drop affects the steepness of the downhill line.

Use m=riserun to Find the Slope of a Line from its Graph

Now, we’ll look at some graphs on the xy-coordinate plane and see how to find their slopes. The method will be very similar to what we just modeled on our geoboards.

To find the slope, we must count out the rise and the run. But where do we start?

We locate two points on the line whose coordinates are integers. We then start with the point on the left and sketch a right triangle, so we can count the rise and run.

In the last two examples, the lines had y-intercepts with integer values, so it was convenient to use the y-intercept as one of the points to find the slope. In the next example, the y-intercept is a fraction. Instead of using that point, we’ll look for two other points whose coordinates are integers. This will make the slope calculations easier.

Use the Slope Formula to find the Slope of a Line Between Two Points

Sometimes we’ll need to find the slope of a line between two points when we don’t have a graph to count out the rise and the run. We could plot the points on grid paper, then count out the rise and the run, but as we’ll see, there is a way to find the slope without graphing. Before we get to it, we need to introduce some algebraic notation.

We have seen that an ordered pair (x,y) gives the coordinates of a point. But when we work with slopes, we use two points. How can the same symbol (x,y) be used to represent two different points? Mathematicians use subscripts to distinguish the points.

(x1,y1)read ‘xsub 1,ysub 1’ (x2,y2)read ‘xsub 2,ysub 2’

The use of subscripts in math is very much like the use of last name initials in elementary school. Maybe you remember Laura C. and Laura M. in your third grade class?

We will use (x1,y1) to identify the first point and (x2,y2) to identify the second point.

If we had more than two points, we could use (x3,y3), (x4,y4), and so on.

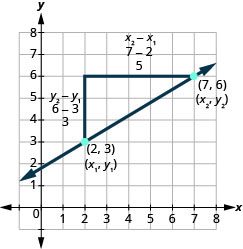
Let’s see how the rise and run relate to the coordinates of the two points by taking another look at the slope of the line between the points (2,3) and (7,6).

A line passes through the marked points (2, 3) and (7, 6), labeled (x1, y1) and (x2, y2). The right triangle has corner (2, 6). Its vertical leg from (2, 3) to (2, 6) is labeled y2 - y1, 6 - 3, and 3; its horizontal leg from (2, 6) to (7, 6) is labeled x2 - x1, 7 - 2, and 5. Labeled ticks run from 0 to 8 on both axes.

Since we have two points, we will use subscript notation, (2,x1,3y1)(7,6x2,y2).

On the graph, we counted the rise of 3 and the run of 5.

Notice that the rise of 3 can be found by subtracting the y-coordinates 6 and 3.

3=6−3

And the run of 5 can be found by subtracting the x-coordinates 7 and 2.

5=7−2

We know m=riserun. So m=35.

We rewrite the rise and run by putting in the coordinates m=6−37−2.

But 6 is y2, the y-coordinate of the second point and 3 is y1, the y-coordinate of the first point.

So we can rewrite the slope using subscript notation. m=y2−y17−2

Also, 7 is x2, the x-coordinate of the second point and 2 is x1, the x-coordinate of the first point.

So, again, we rewrite the slope using subscript notation. m=y2−y1x2−x1

We’ve shown that m=y2−y1x2−x1 is really another version of m=riserun. We can use this formula to find the slope of a line when we have two points on the line.

Practice Makes Perfect

Use Geoboards to Model Slope

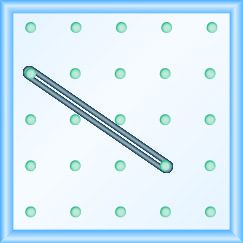
In the following exercises, find the slope modeled on each geoboard.
Interactive figurePractice Modeling Slope on a GeoboardDrag inside the figure to pan; scroll to zoom.
An empty 5-by-5 geoboard grid with no rubber band placed yet. Users can drag endpoints to stretch a band between any two pegs, and a readout displays the resulting slope. Viewing window: x from -6.44 to 10.44, y from -3.22 to 7.22.
XYZ Graph · viewer build 5edf91b
This interactive geoboard lets you explore slope by stretching rubber bands between pegs. Drag the endpoints to create lines with different rises and runs, and watch the slope value update in real time. Use this space to test your understanding of how vertical and horizontal changes affect the steepness and direction of a line.
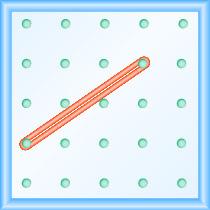
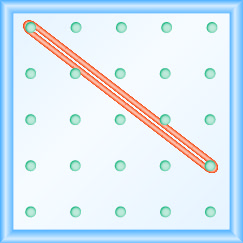
The figure shows a grid of evenly spaced pegs. There are 5 columns and 5 rows of pegs. A rubber band is stretched between the peg in column 1, row 3 and the peg in column 5, row 2, forming a line.
Show solution

14

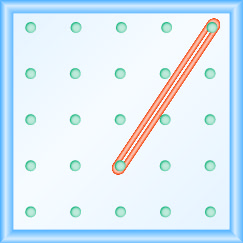
The figure shows a grid of evenly spaced pegs. There are 5 columns and 5 rows of pegs. A rubber band is stretched between the peg in column 2, row 4 and the peg in column 5, row 2, forming a line.
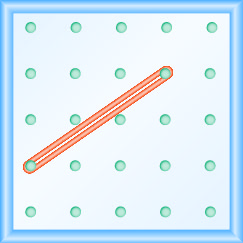
The figure shows a grid of evenly spaced pegs. There are 5 columns and 5 rows of pegs. A rubber band is stretched between the peg in column 1, row 4 and the peg in column 4, row 2, forming a line.
Show solution

23

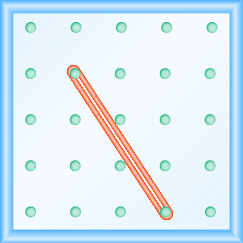
The figure shows a grid of evenly spaced pegs. There are 5 columns and 5 rows of pegs. A rubber band is stretched between the peg in column 3, row 4 and the peg in column 5, row 1, forming a line.
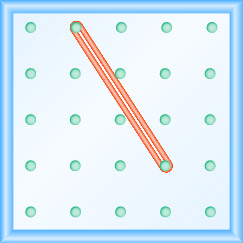
The figure shows a grid of evenly spaced pegs. There are 5 columns and 5 rows of pegs. A rubber band is stretched between the peg in column 2, row 1 and the peg in column 4, row 4, forming a line.
Show solution

−32=−32

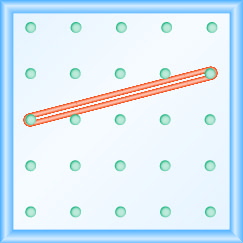
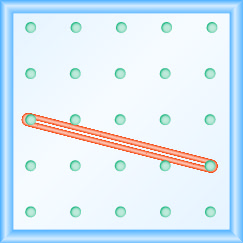
The figure shows a grid of evenly spaced pegs. There are 5 columns and 5 rows of pegs. A rubber band is stretched between the peg in column 1, row 3 and the peg in column 5, row 4, forming a line.
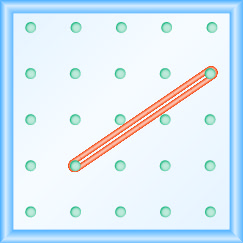
The figure shows a grid of evenly spaced pegs. There are 5 columns and 5 rows of pegs. A rubber band is stretched between the peg in column 1, row 1 and the peg in column 5, row 4, forming a line.
Show solution

−34

The figure shows a grid of evenly spaced pegs. There are 5 columns and 5 rows of pegs. A rubber band is stretched between the peg in column 2, row 2 and the peg in column 4, row 5, forming a line.

In the following exercises, model each slope. Draw a picture to show your results.

23

Show solution

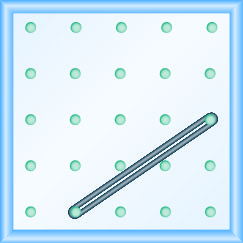
The figure shows a grid of evenly spaced pegs. There are 5 columns and 5 rows of pegs. A rubber band is stretched between the peg in column 2, row 5 and the peg in column 5, row 3, forming a line.

34

14

Show solution

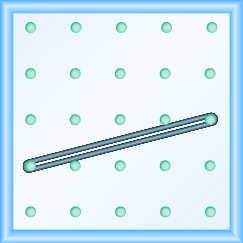
The figure shows a grid of evenly spaced pegs. There are 5 columns and 5 rows of pegs. A rubber band is stretched between the peg in column 1, row 4 and the peg in column 5, row 3, forming a line.

43

−12

Show solution

The figure shows a grid of evenly spaced pegs. There are 5 columns and 5 rows of pegs. A rubber band is stretched between the peg in column 1, row 4 and the peg in column 3, row 5, forming a line.

−34

−23

Show solution

The figure shows a grid of evenly spaced pegs. There are 5 columns and 5 rows of pegs. A rubber band is stretched between the peg in column 1, row 2 and the peg in column 4, row 4, forming a line.

−32

Use m=riserun to find the Slope of a Line from its Graph

In the following exercises, find the slope of each line shown.
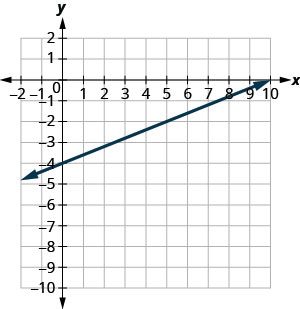
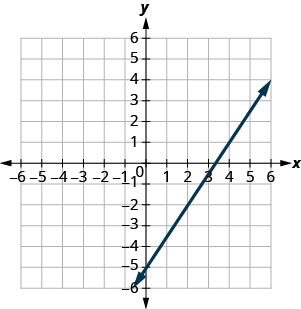
The line rises through (0, -4), (5, -2), and (10, 0). Labeled ticks run from -2 to 10 on the x-axis and -10 to 2 on the y-axis.
Show solution

25

The graph shows the x y coordinate plane. Labeled ticks run from -6 to 6 on both axes. A line passes through the points (negative 2, negative 8) and (2, negative 2).
The graph shows the x y coordinate plane. Labeled ticks run from -6 to 6 on both axes. A line passes through the points (negative 4, negative 6) and (4, 4).
Show solution

54

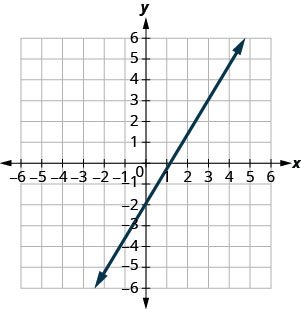
The graph shows the x y coordinate plane. Labeled ticks run from -6 to 6 on both axes. A line intercepts the y-axis at (0, negative 2) and passes through the point (3, 3).
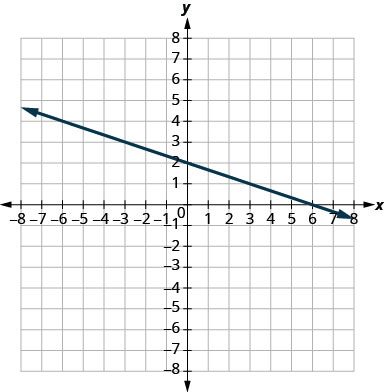
The graph shows the x y coordinate plane. Labeled ticks run from -8 to 8 on both axes. A line passes through the points (negative 3, 3) and (3, 1).
Show solution

−13

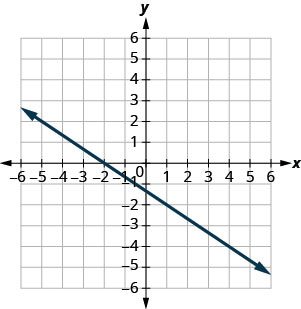
The graph shows the x y coordinate plane. Labeled ticks run from -8 to 8 on both axes. A line passes through the points (negative 2, 4) and (2, 2).
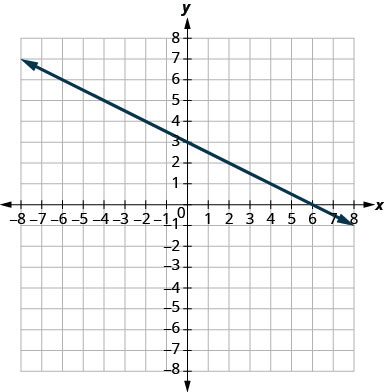
The graph shows the x y coordinate plane. Labeled ticks run from -8 to 8 on both axes. A line intercepts the y-axis at (0, 6) and passes through the point (4, 3).
Show solution

−34

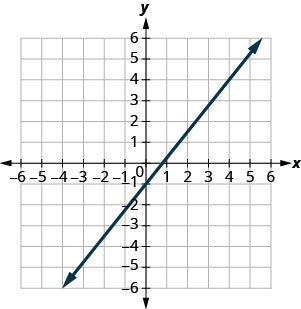
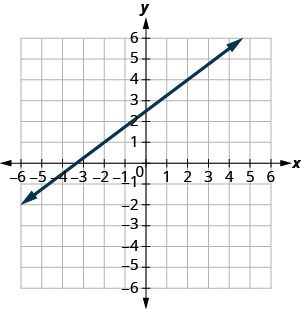
The graph shows the x y coordinate plane. Labeled ticks run from -6 to 6 on both axes. A line passes through the point (negative 3, 1) and intercepts the y-axis at (0, negative 1).
The graph shows the x y coordinate plane. Labeled ticks run from -6 to 6 on both axes. A line passes through the points (negative 2, 1) and (2, 4).
Show solution

34

The graph shows the x y coordinate plane. Labeled ticks run from -6 to 6 on both axes. A line passes through the points (negative 1, 1) and (2, 3).
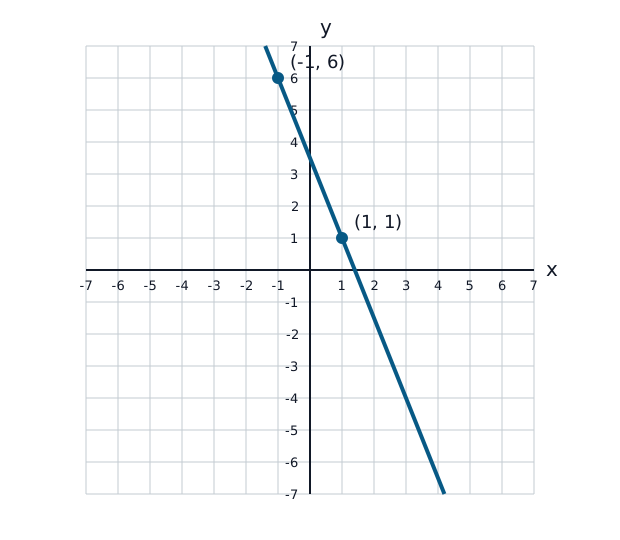
A descending line passes through the explicitly marked points (-1, 6) and (1, 1). Both coordinate axes use equally spaced unit ticks; x is horizontal and y is vertical. The displayed line is the precise editorial graph for this exercise.
Show solution

−52

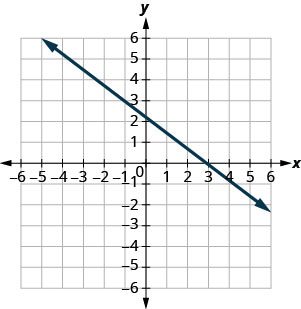
The graph shows the x y coordinate plane. Labeled ticks run from -6 to 6 on both axes. A line passes through the point (negative 1, 3) and intercepts the x-axis at (3, 0).
The graph shows the x y coordinate plane. Labeled ticks run from -8 to 8 on both axes. A line passes through the points (negative 2, 6) and (1, 4).
Show solution

−23

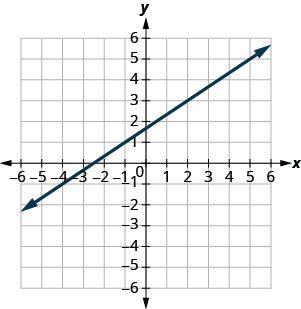
The graph shows the x y coordinate plane. Labeled ticks run from -6 to 6 on both axes. A line passes through the points (negative 1, 3) and (1, 2).
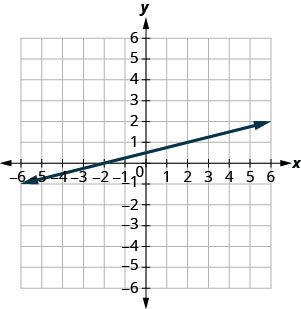
The graph shows the x y coordinate plane. Labeled ticks run from -6 to 6 on both axes. A line intercepts the x-axis at (negative 2, 0) and passes through the point (2, 1).
Show solution

14

The graph shows the x y coordinate plane. Labeled ticks run from -6 to 6 on both axes. A line passes through the points (4, 2) and (7, 3).

Use the Slope Formula to find the Slope of a Line between Two Points

In the following exercises, use the slope formula to find the slope of the line between each pair of points.

(1,4),(3,9)

Show solution

52

(2,3),(5,7)

(0,3),(4,6)

Show solution

34

(0,1),(5,4)

(2,5),(4,0)

Show solution

−52

(3,6),(8,0)

(−3,3),(4,−5)

Show solution

−87

(−2,4),(3,−1)

(−1,−2),(2,5)

Show solution

73

(−2,−1),(6,5)

(4,−5),(1,−2)

Show solution

−1

(3,−6),(2,−2)

Corequisite Skills for Introductory Statistics is a custom course edition compiled for Introductory Statistics corequisite courses from OpenStax Contemporary Mathematics, Elementary Algebra 2e, Intermediate Algebra 2e, Prealgebra 2e. Content by OpenStax is reproduced as published, apart from any corrections recorded for this edition. Sections are renumbered to follow the course outline. The course outline is adapted from Larry Green's Support Course for Elementary Statistics (LibreTexts, https://stats.libretexts.org/Bookshelves/Introductory_Statistics/Support_Course_for_Elementary_Statistics), used under CC BY 4.0 (https://creativecommons.org/licenses/by/4.0/). Lessons 2.4 and 6.7 are written for this edition by XYZ Homework. Every OpenStax lesson is abridged to the subsections and practice exercises this course uses. Lessons are headed with their course titles, not the source section titles. Access the complete originals free at openstax.org. License: CC-BY-NC-SA-4.0.

⇩ Download ▾

These eBooks are a prerelease and are not yet certified conformant with WCAG 2.1 AA or any other accessibility standard. Every page is built against an automated accessibility gate, and our target for the published editions is WCAG 2.2 Level AA. If something is unusable, please tell us.