

6.1 Plotting Ordered Pairs
Plotting Ordered Pairs
A source-bound narrated opening with a worked example, an eight-second thinking pause, a checked result, English captions, and a transcript.
Read the transcriptDownload the videoNarration credits and licences
Plot Points on a Rectangular Coordinate System
Just like maps use a grid system to identify locations, a grid system is used in algebra to show a relationship between two variables in a rectangular coordinate system. The rectangular coordinate system is also called the xy-plane or the ‘coordinate plane’.
The horizontal number line is called the x-axis. The vertical number line is called the y-axis. The x-axis and the y-axis together form the rectangular coordinate system. These axes divide a plane into four regions, called quadrants. The quadrants are identified by Roman numerals, beginning on the upper right and proceeding counterclockwise. See Figure 6.1.
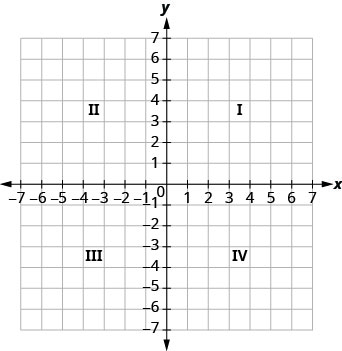
In the rectangular coordinate system, every point is represented by an ordered pair. The first number in the ordered pair is the x-coordinate of the point, and the second number is the y-coordinate of the point.
The phrase ‘ordered pair’ means the order is important. What is the ordered pair of the point where the axes cross? At that point both coordinates are zero, so its ordered pair is . The point has a special name. It is called the origin.
We use the coordinates to locate a point on the xy-plane. Let’s plot the point as an example. First, locate 1 on the x-axis and lightly sketch a vertical line through . Then, locate 3 on the y-axis and sketch a horizontal line through . Now, find the point where these two lines meet—that is the point with coordinates .
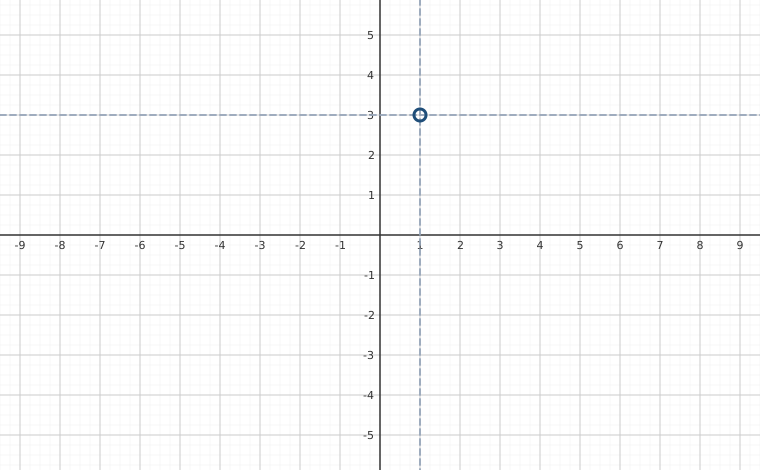
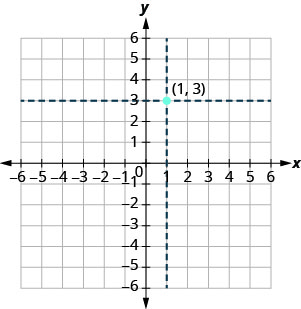
Notice that the vertical line through and the horizontal line through are not part of the graph. We just used them to help us locate the point .
How do the signs affect the location of the points? You may have noticed some patterns as you graphed the points in the previous example.
For the point in Figure 6.2 in Quadrant IV, what do you notice about the signs of the coordinates? What about the signs of the coordinates of points in the third quadrant? The second quadrant? The first quadrant?
Can you tell just by looking at the coordinates in which quadrant the point is located? In which quadrant is located?
What if one coordinate is zero as shown in Figure 6.3? Where is the point located? Where is the point located?
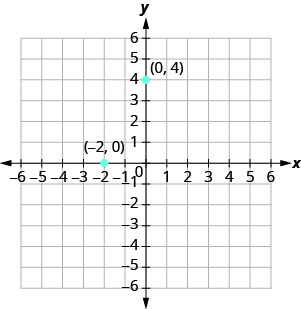
The point is on the y-axis and the point is on the x-axis.
In algebra, being able to identify the coordinates of a point shown on a graph is just as important as being able to plot points. To identify the x-coordinate of a point on a graph, read the number on the x-axis directly above or below the point. To identify the y-coordinate of a point, read the number on the y-axis directly to the left or right of the point. Remember, when you write the ordered pair use the correct order, .
Practice Makes Perfect
Plot Points in a Rectangular Coordinate System
In the following exercises, plot each point in a rectangular coordinate system and identify the quadrant in which the point is located.
- ⓐ
- ⓑ
- ⓒ
- ⓓ
ⓔ
Show solution
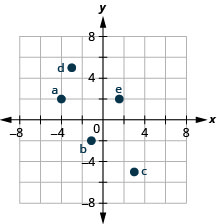
- ⓐ
- ⓑ
- ⓒ
- ⓓ
- ⓔ
- ⓐ
- ⓑ
- ⓒ
- ⓓ
- ⓔ
Show solution
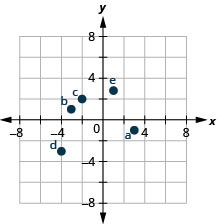
- ⓐ
- ⓑ
- ⓒ
- ⓓ
- ⓔ
In the following exercises, plot each point in a rectangular coordinate system.
- ⓐ
- ⓑ
- ⓒ
- ⓓ
- ⓔ
Show solution
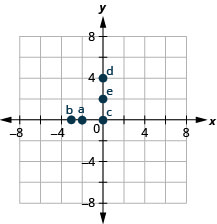
- ⓐ
- ⓑ
- ⓒ
- ⓓ
- ⓔ
- ⓐ
- ⓑ
- ⓒ
- ⓓ
- ⓔ
Show solution
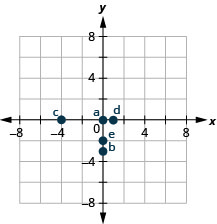
- ⓐ
- ⓑ
- ⓒ
- ⓓ
- ⓔ
In the following exercises, name the ordered pair of each point shown in the rectangular coordinate system.
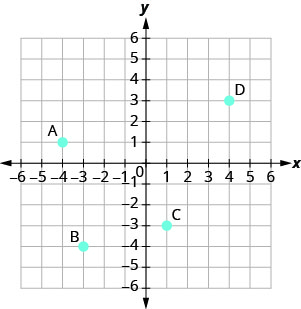
Show solution
A: B: C: D:
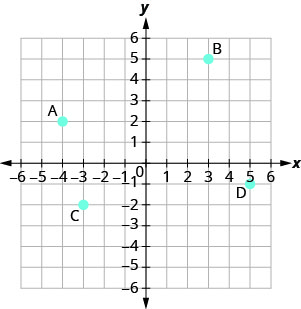
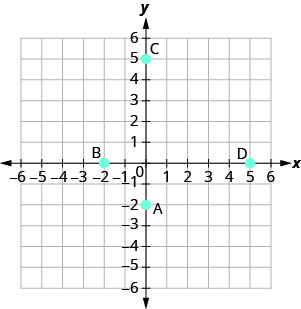
Show solution
A: B: C: D:
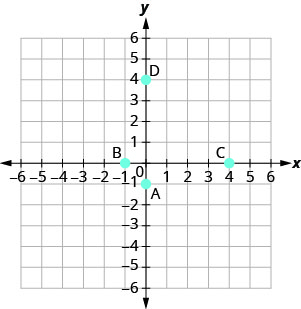
Corequisite Skills for Introductory Statistics is a custom course edition compiled for Introductory Statistics corequisite courses from OpenStax Contemporary Mathematics, Elementary Algebra 2e, Intermediate Algebra 2e, Prealgebra 2e. Content by OpenStax is reproduced as published, apart from any corrections recorded for this edition. Sections are renumbered to follow the course outline. The course outline is adapted from Larry Green's Support Course for Elementary Statistics (LibreTexts, https://stats.libretexts.org/Bookshelves/Introductory_Statistics/Support_Course_for_Elementary_Statistics), used under CC BY 4.0 (https://creativecommons.org/licenses/by/4.0/). Lessons 2.4 and 6.7 are written for this edition by XYZ Homework. Every OpenStax lesson is abridged to the subsections and practice exercises this course uses. Lessons are headed with their course titles, not the source section titles. Access the complete originals free at openstax.org. License: CC-BY-NC-SA-4.0.