
7.2 The General Sinusoidal Function
Horizontal Shifts
In the previous section we considered transformations of sinusoidal graphs, including vertical shifts, which change the midline of the graph, vertical stretches and compressions, which change its amplitude, and horizontal stretches and compressions, which occur when we change the period of the graph.
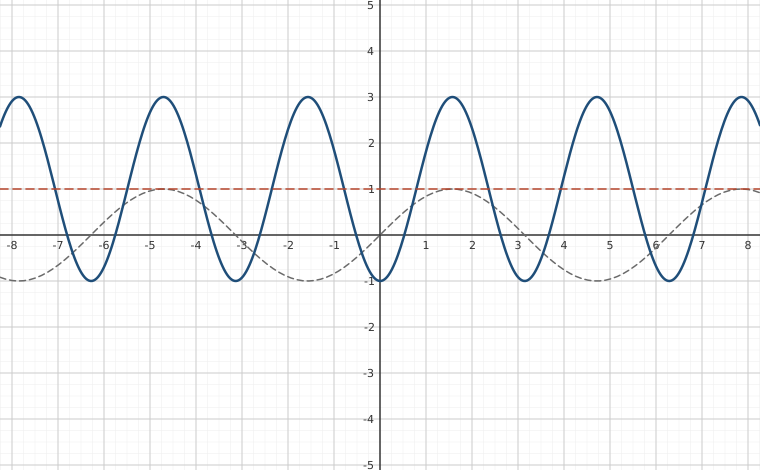
In this section we consider one more transformation, shifting the graph horizontally. The figure below shows four different transformations of the graph of .
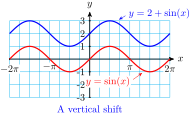
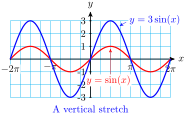
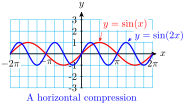
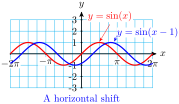
Graph and for . How is the graph of different from the graph of ?
The graph of is shifted units to the left of .
The examples above illustrate the following principle.
We can use a table of values to sketch graphs that involve horizontal shifts.
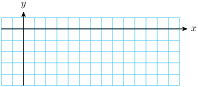
Complete the table and sketch a graph of on the grid below. (Do you expect the graph to be shifted to the left or to the right, compared to the graph of ?)
Combining Transformations
The order in which we apply transformations to a function makes a difference in the graph. We'll compare the graphs of the two functions
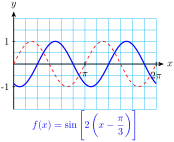
Graph the two functions for , along with , as shown below. Each graph involves a horizontal shift relative to , but the graph of is shifted units to the right, while the graph of is shifted only units to the right. This difference occurs because of the order of the transformations.
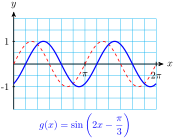
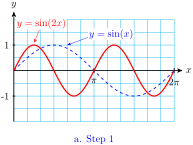
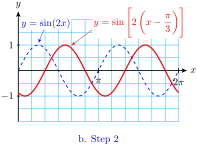
We transform the graph of into the graph of in two steps:
Step 1: First we replace by to get , which compresses the graph horizontally by a factor of 2. (See figure (a) below.)
Step 2: Then we replace by to get , which shifts the graph units to the right. (See figure (b).)
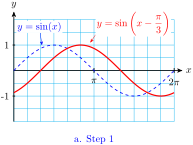
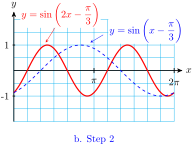
To transform the graph of into the graph of , we perform the two steps in the opposite order:
Step 1: We replace by which shifts the graph units to the right. (See figure (a).)
Step 2: Then we replace by to get which compresses the graph horizontally by a factor of 2, including the horizontal shift. This reduces the horizontal shift from to . (See figure (b.)
It is easier to analyze the transformations in the function , because we can read the horizontal shift from the formula.
where is the compression factor and is the horizontal shift.
We can write the formula for in the same easy-to-analyze form by factoring the input for the sine function:
In general, if we write the formula for a sinusoidal function in standard form, we can read all the transformations from the constants in the formula.
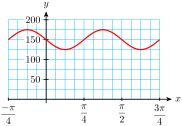
- State the midline, amplitude, period, and horizontal shift of the graph of
- Make a table of values and sketch a graph of the function.
- midline: , amplitude: , period: , horizontal shift: to the right
Modeling with Sinusoidal Functions
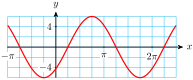
In Section 7.1 we found formulas for sinusoidal functions that start on the midline, or at their maximum or minimum value. We can use horizontal transformations to write formulas for functions that start at other points on the cycle.
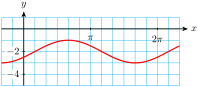
Find a formula for the sinusoidal function whose graph is shown at right.
Many natural phenomena can be modeled with sinusoidal functions.
The figure below shows the sunspot data for the solar cycle that began in July 1996, and a curve of best fit calculated by NASA. This curve is not sinusoidal, but has a similar shape.
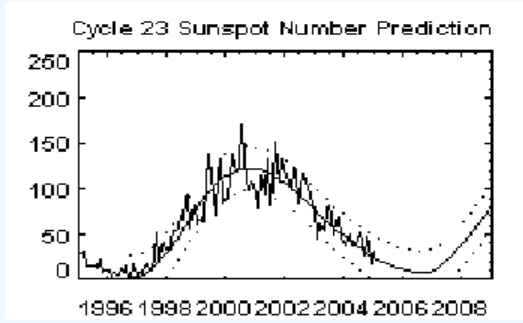
- The minimum sunspot number occurred in October 1996. Use the graph to estimate the period, midline, and amplitude of a sinusoidal function that approximates the data.
- Write a function that approximates the data.
- Use your function to predict the sunspot number in January, 2005.
- Period: 10 years, midline: , amplitude: 53
- 37
Review the following skills you will need for this section.
Section 7.2 Summary
Concepts
- The order in which we apply transformations to a function makes a difference in the graph.
Study Questions
- Which of the following functions are the same? Explain your answer.
- Which of the following functions are the same? Explain your answer. For questions 3 and 4, calculate the horizontal shift.
Skills
- Graph trigonometric functions using a table of values #1–6, 11–16
- Find a formula for a transformation of a trigonometric function #7–10, 17–26
- Solve trigonometric equations graphically #1–6, 11–16
- Model periodic phenomena with trigonometric functions #27–30
- Fit a circular function to data #31–34
Homework 7-2
and
- Fill in the table of values.
- Sketch the graphs of and on the same axes.
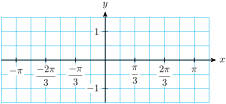
- What is the horizontal shift from to ?
- Find all values of for which , for .
- Find all values of for which , for .
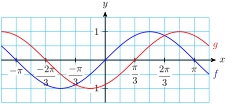
- to the right
and
- Fill in the table of values.
- Sketch the graphs of and on the same axes.
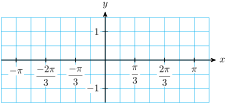
- What is the horizontal shift from to ?
- Find all values of for which , for .
- Find all values of for which , for .
and
- Fill in the table of values.
Sketch the graphs of and on the same axes.
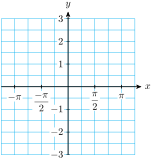
- What is the horizontal shift from to ?
- Solve , for .
- Solve , for .
undef undef undef undef 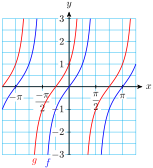
- to the left
and
- Fill in the table of values.
Sketch the graphs of and on the same axes.
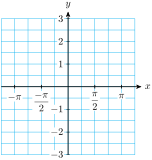
- What is the horizontal shift from to ?
- Solve , for .
- Solve , for .
- What are the amplitude and the horizontal shift?
- Fill in the table of values.
- Sketch the graph.
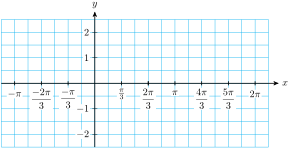
- Solve , for
- Solve , for
- amplitude 2, shift to the left
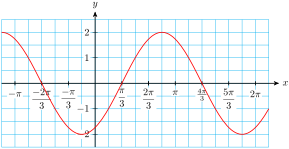
- What are the amplitude and the horizontal shift?
- Fill in the table of values.
- Sketch the graph.
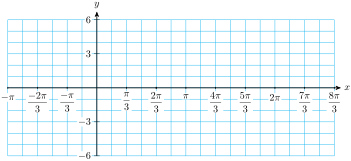
- Solve , for
- Solve , for
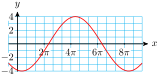
The figure shows the graph of .
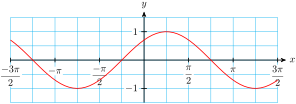
- Find a formula for as a shift of the sine function.
- Find a formula for as a shift of the cosine function.
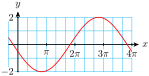
The figure shows the graph of .
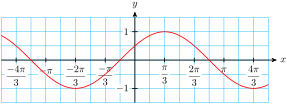
- Find a formula for as a shift of the sine function.
- Find a formula for as a shift of the cosine function.
The figure shows the graph of .
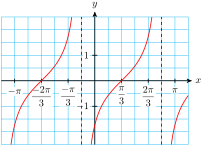
- Find a formula for as a shift of the tangent function.
- Find another formula for as a different shift of the tangent function.
The figure shows the graph of .
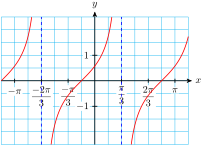
- Find a formula for as a shift of the tangent function.
- Find another formula for as a different shift of the tangent function.
- What are the period and the horizontal shift? (Hint: Factor out 2 from .)
- Fill in the table of values.
- Sketch the graph.
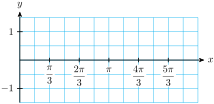
- Solve , for
- Solve , for
- period , shift to the right
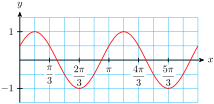
- What are the period and the horizontal shift? (Hint: Factor out 3 from .)
- Fill in the table of values.
- Sketch the graph.
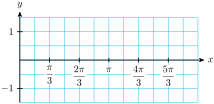
- Solve , for
- Solve , for
- What are the period and the horizontal shift? (Hint: Factor out from .)
- Fill in the table of values.
- Sketch the graph.
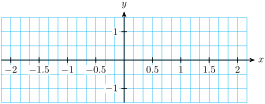
- Solve , for
- Solve , for
- period 2, shift to the left
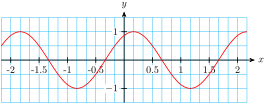
- What are the period and the horizontal shift? (Hint: Factor out from .)
- Fill in the table of values.
- Sketch the graph.
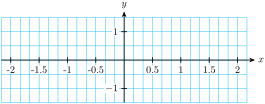
- Solve , for
- Solve , for
- What are the midline, period, horizontal shift, and amplitude?
- Fill in the table of values.
- Sketch the graph.
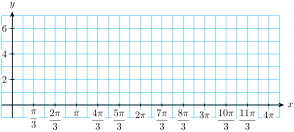
- Solve for :
- Solve for :
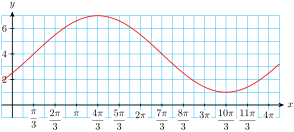
- midline , period , horizontal shift to the right, amplitude 3
- no solution for
- What are the midline, period, horizontal shift, and amplitude?
- Fill in the table of values.
- Sketch the graph.
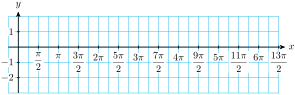
- Solve for :
- Solve for :
Find a formula for a sinusoidal function that has an amplitude of 2, a period of 3, and is shifted 4 units to the left and 5 units upwards compared with the sine function. Sketch the graph for .
Find a formula for a sinusoidal function that has an amplitude of 3, a period of 24, and is shifted 2 units to the right and 4 units upwards compared with the cosine function. Sketch the graph for .
Find a formula for a sinusoidal function that has an amplitude of 5, a period of 360, its midline at , and passes through . Sketch the graph for .
Find a formula for a sinusoidal function that has an amplitude of 50, a period of 30, its midline at , and passes through . Sketch the graph for .
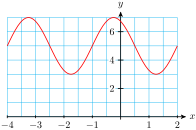
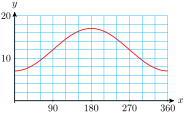
For Problems 21–26, find a formula for the circular function whose graph is shown.
- Write the function in the form .
- Write the function in the form
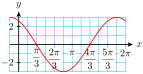
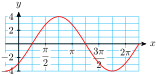
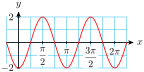
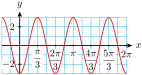
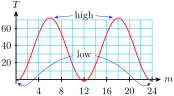
The average daily high temperature in Fairbanks, Alaska can be approximated by a sinusoidal function with a period of 12 months. The low temperature of occurs in January, and the high temperature of in July.
- What are the midline, period, and amplitude?
- Write a formula for the average daily high temperature , where is the number of months since January.
- Graph for two periods, labeling the points that correspond to highest and lowest average temperature.
- midline , period 12, amplitude 36.95
Depending on its phase, the moon looks like a disk that is partially visible and partially in shadow. The visible fraction ranges from 0% to 100%, and can be approximated by a sinusoidal function , where is the number of days since the last full moon. The time between successive full moons (a lunar month) is 29.5 days.
- What are the period, midline, and amplitude of ?
- Write a formula for .
- Graph your function over two periods, labeling the points that correspond to full moon, half moon, and new moon.
The tide in Yorktown is approximated by the function
measured in feet above low tide, where is the number of hours since the last low tide.
- What are the midline, period, and amplitude?
- Graph for two periods, labeling the points that correspond to high tide and low tide.
- If the last low tide occurred at 5:00 am, predict when the next high and low tides will occur.
- midline , period , amplitude 1.4
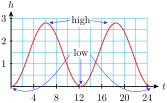
- high 11:10 am, low 5:19 pm
The height of a child's toy suspended at the end of a spring is approximated by a sinusoidal function. The toy's height ranges between 200 centimeters and 260 centimeters above the ground, and it completes one up-and-down cycle every 0.8 second.
- What are the midline, period, and amplitude?
- Let be the height of the toy in centimeters, where seconds corresponds to a time when the object was at the midline and moving upwards. Graph for two periods, labeling the points that correspond to the high and low positions of the toy.
- When does the toy reach its maximum height the second time?
In Problems 31–34,
- Estimate the amplitude, period, and midline of a circular function that fits the data.
- Write a formula for the function.
- amplitude 3.2, period 2, midline
- amplitude 5, period 1, midline
Trigonometry by Katherine Yoshiwara (yoshiwarabooks.org), GNU Free Documentation License 1.2 or later. Adapted for the XYZ HTML edition with the authors' permission (recorded 2026-07-04). License: GFDL-1.2-or-later.