
2.4 Inequalities with Absolute Value and Quadratic Functions
In this section, not only do we develop techniques for solving various classes of inequalities analytically, we also look at them graphically. The first example motivates the core ideas.
The preceding example demonstrates the following, which is a consequence of the Fundamental Graphing Principle for Functions.
Graphical Interpretation of Equations and Inequalities
Suppose and are functions.
- The solutions to are the values where the graphs of and intersect.
- The solution to is the set of values where the graph of is below the graph of .
- The solution to is the set of values where the graph of above the graph of .
The next example turns the tables and furnishes the graphs of two functions and asks for solutions to equations and inequalities.
We now turn our attention to solving inequalities involving the absolute value. We have the following theorem from Intermediate Algebra to help us.
As with Theorem in Section, we could argue Theorem using cases. However, in light of what we have developed in this section, we can understand these statements graphically. For instance, if , the graph of is a horizontal line which lies above the -axis through . To solve , we are looking for the values where the graph of is below the graph of . We know that the graphs intersect when , which, from Section, we know happens when or . Graphing, we get
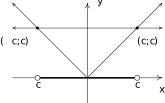
We see that the graph of is below for between and , and hence we get is equivalent to . The other properties in Theorem can be shown similarly.
We now turn our attention to quadratic inequalities. In the last example of Section, we needed to determine the solution to . We will now re-visit this problem using some of the techniques developed in this section not only to reinforce our solution in Section, but to also help formulate a general analytic procedure for solving all quadratic inequalities. If we consider and , then solving corresponds graphically to finding the values of for which the graph of (the parabola) is below the graph of (the -axis). We've provided the graph again for reference.
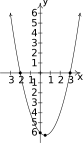
We can see that the graph of does dip below the -axis between its two -intercepts. The zeros of are and in this case and they divide the domain (the -axis) into three intervals: , and . For every number in , the graph of is above the -axis; in other words, for all in . Similarly, for all in , and for all in . We can schematically represent this with the sign diagram below.
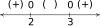
Here, the above a portion of the number line indicates for those values of ; the indicates there. The numbers labeled on the number line are the zeros of , so we place above them. We see at once that the solution to is .
Our next goal is to establish a procedure by which we can generate the sign diagram without graphing the function. An important property2 of quadratic functions is that if the function is positive at one point and negative at another, the function must have at least one zero in between. Graphically, this means that a parabola can't be above the -axis at one point and below the -axis at another point without crossing the -axis. This allows us to determine the sign of all of the function values on a given interval by testing the function at just one value in the interval. This gives us the following.
Steps for Solving a Quadratic Inequality
- Rewrite the inequality, if necessary, as a quadratic function on one side of the inequality and on the other.
- Find the zeros of and place them on the number line with the number above them.
- Choose a real number, called a test value, in each of the intervals determined in step 2.
- Determine the sign of for each test value in step 3, and write that sign above the corresponding interval.
- Choose the intervals which correspond to the correct sign to solve the inequality.
One of the classic applications of inequalities is the notion of tolerances.5 Recall that for real numbers and , the quantity may be interpreted as the distance from to . Solving inequalities of the form for can then be interpreted as finding all numbers which lie within units of . We can think of the number as a `tolerance' and our solutions as being within an accepted tolerance of . We use this principle in the next example.
Our last example in the section demonstrates how inequalities can be used to describe regions in the plane, as we saw earlier in Section.
Exercises
In Exercises -, solve the inequality. Write your answer using interval notation.
- The profit, in dollars, made by selling bottles of All-Natural Certified Free-Trade Organic Sasquatch Tonic is given by , for . How many bottles of tonic must be sold to make at least in profit?
- Suppose , represents the costs, in hundreds of dollars, to produce thousand pens. Find the number of pens which can be produced for no more than .
- The temperature , in degrees Fahrenheit, hours after 6 AM is given by , for . When is it warmer than Fahrenheit?
- The height in feet of a model rocket above the ground seconds after lift-off is given by , for . When is the rocket at least feet off the ground? Round your answer to two decimal places.
- If a slingshot is used to shoot a marble straight up into the air from 2 meters above the ground with an initial velocity of 30 meters per second, for what values of time will the marble be over 35 meters above the ground? (Refer to Exercise in Section for assistance if needed.) Round your answers to two decimal places.
- What temperature values in degrees Celsius are equivalent to the temperature range to ? (Refer to Exercise in Section for assistance if needed.)
- Find all real numbers so that is within units of .
- Find all real numbers so that is within units of .
- Find all real numbers so that is within unit of .
- Find all real numbers so that is at least units away from .
- The surface area of a cube with edge length is given by for . Suppose the cubes your company manufactures are supposed to have a surface area of exactly 42 square centimeters, but the machines you own are old and cannot always make a cube with the precise surface area desired. Write an inequality using absolute value that says the surface area of a given cube is no more than 3 square centimeters away (high or low) from the target of 42 square centimeters. Solve the inequality and write your answer using interval notation.
- Suppose is a function, is a real number and is a positive number. Discuss with your classmates what the inequality means algebraically and graphically.6
- Prove the second, third and fourth parts of Theorem.
In Exercises -, write and solve an inequality involving absolute values for the given statement.
In Exercises -, sketch the graph of the relation.
Answers
- No solution
- No Solution.
- No solution
- No solution
- on . This means anywhere between 10 and 15 bottles of tonic need to be sold to earn at least in profit.
- on . This means anywhere between 2000 and 8000 pens can be produced and the cost will not exceed .
- on , which corresponds to between 7:22 AM (1.37 hours after 6 AM) to 8:38 PM (14.63 hours after 6 AM.) However, since the model is valid only for , , we restrict our answer and find it is warmer than Fahrenheit from 7:22 AM to 6 PM.
- on . This means the rocket is at least 250 feet off the ground between 2.93 and 17.07 seconds after lift off.
- . on (approximately) . This means between 1.44 and 4.68 seconds after it is launched into the air, the marble is more than 35 feet off the ground.
- From our previous work so becomes .
- ,
- ,
- ,
- ,
- Solving , and disregarding the negative solutions yields . The edge length must be within and centimeters.
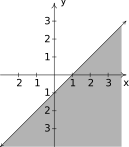
Figure 2.102 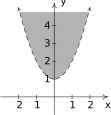
Figure 2.103 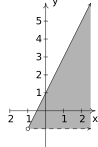
Figure 2.104 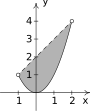
Figure 2.105 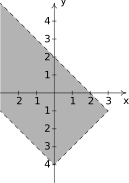
Figure 2.106 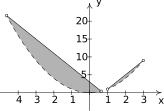
Figure 2.107
Adapted from Precalculus, 3rd corrected edition, by Carl Stitz and Jeff Zeager (stitz-zeager.com), licensed under CC BY-NC-SA 3.0. Changes were made: reformatted as an accessible XYZ web edition. License: CC-BY-NC-SA-3.0.