You may recall studying quadratic equations in Intermediate Algebra. In this section, we review those equations in the context of our next family of functions: the quadratic functions.
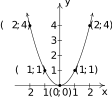
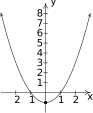
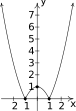
The most basic quadratic function is , whose graph appears below. Its shape should look familiar from Intermediate Algebra – it is called a parabola. The point is called the vertex of the parabola. In this case, the vertex is a relative minimum and is also the where the absolute minimum value of can be found.
Interactive figureWhere the vertex hides in y = ax² + bx + cDrag the Coefficient a, Coefficient b and Coefficient c sliders.
XYZ Graph · viewer build 5edf91b
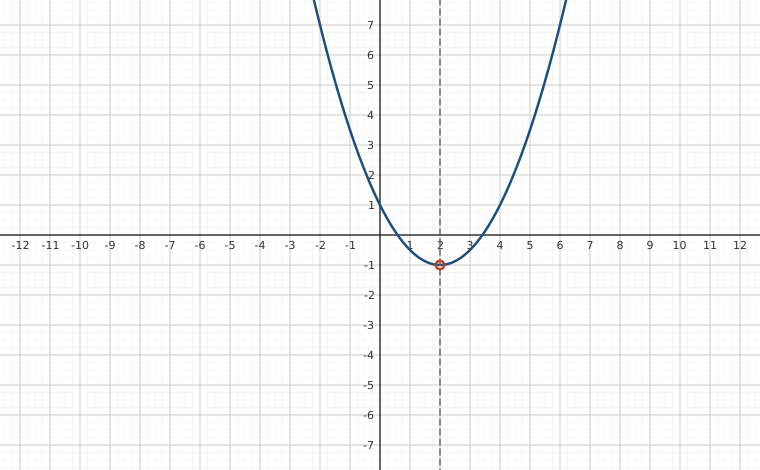
A parabola in standard form, y = ax² + bx + c, with the three coefficients on sliders. The marked point is the vertex, computed from the coefficients as (−b/(2a), c − b²/(4a)), and the dashed line is the axis of symmetry x = −b/(2a). Change b and the vertex slides along a hidden parabola of its own; change c and the whole graph rises or falls; change a and the parabola opens wider, narrower or downward, dragging the vertex with it. The formula the section derives is what keeps the marked point glued to the turning point.Figure 2.54
Much like many of the absolute value functions in Section 2.2, knowing the graph of enables us to graph an entire family of quadratic functions using transformations.
A few remarks about Example 2.3.1 are in order. First note that neither the formula given for nor the one given for match the form given in Definition 2.5. We could, of course, convert both and into that form by expanding and collecting like terms. Doing so, we find and . While these `simplified' formulas for and satisfy Definition 2.5, they do not lend themselves to graphing easily. For that reason, the form of and presented in Example 2.3.2 is given a special name, which we list below, along with the form presented in Definition 2.5.
It is important to note at this stage that we have no guarantees that every quadratic function can be written in standard form. This is actually true, and we prove this later in the exposition, but for now we celebrate the advantages of the standard form, starting with the following theorem.
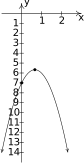
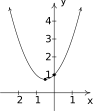
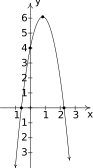
We can readily verify the formula given Theorem 2.2 with the two functions given in Example 2.3.1. After a (slight) rewrite, , and we identify and . Sure enough, we found the vertex of the graph of to be . For , no rewrite is needed. We can directly identify and and, sure enough, we found the vertex of the graph of to be .
To see why the formula in Theorem 2.2 produces the vertex, consider the graph of the equation . When we substitute , we get , so is on the graph. If , then so is a positive number. If , then is positive, thus is always a number larger than . This means that when , is the lowest point on the graph and thus the parabola must open upwards, making the vertex. A similar argument shows that if , is the highest point on the graph, so the parabola opens downwards, and is also the vertex in this case.
Alternatively, we can apply the machinery in Section 1.7. Since the vertex of is , we can determine the vertex of by determining the final destination of as it is moved through each transformation. To obtain the formula , we start with and first define . This is results in a vertical scaling and/or reflection.3 Since we multiply the output by , we multiply the -coordinates on the graph of by , so the point remains and remains the vertex. Next, we define . This induces a horizontal shift right or left units4 moves the vertex, in either case, to . Finally, which effects a vertical shift up or down units5 resulting in the vertex moving from to .
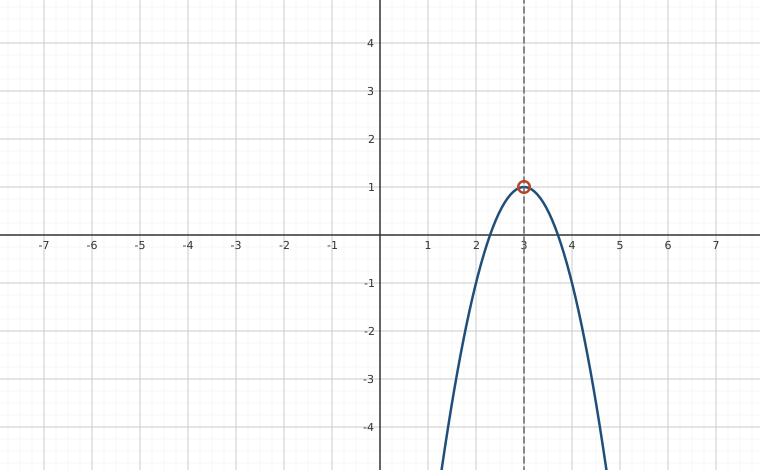
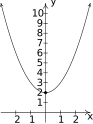
In addition to verifying Theorem 2.2, the arguments in the two preceding paragraphs have also shown us the role of the number in the graphs of quadratic functions. The graph of is a parabola `opening upwards' if , and `opening downwards' if . Moreover, the symmetry enjoyed by the graph of about the -axis is translated to a symmetry about the vertical line which is the vertical line through the vertex.6 This line is called the axis of symmetry of the parabola and is dashed in the figures below.
Interactive figureStandard form y = a(x − h)² + kDrag the Opening factor a, Vertex x-coordinate h and Vertex y-coordinate k sliders.
XYZ Graph · viewer build 5edf91b
Standard form on sliders, opening at the example's h(x) = −2(x − 3)² + 1. For a ≠ 0 the marked point (h, k) is the vertex and the dashed vertical line x = h is the axis of symmetry: a > 0 opens the parabola upward, making (h, k) its lowest point, and a < 0 opens it downward, making (h, k) its highest — at the opening values the vertex (3, 1) is a maximum and the range is (−∞, 1]. Still with a ≠ 0, a larger |a| makes a narrower parabola, and a never moves the vertex: only h and k do, and they do nothing else. At a = 0 the definition's requirement a ≠ 0 earns its keep — the parabola degenerates into the horizontal line y = k, the marked point is just one of its points, and there is no vertex or single axis of symmetry to speak of.Figure 2.59Figure 2.60
Graphs of .
Without a doubt, the standard form of a quadratic function, coupled with the machinery in Section 1.7, allows us to list the attributes of the graphs of such functions quickly and elegantly. What remains to be shown, however, is the fact that every quadratic function can be written in standard form. To convert a quadratic function given in general form into standard form, we employ the ancient rite of `Completing the Square'. We remind the reader how this is done in our next example.
With Example 2.3.2 fresh in our minds, we are now in a position to show that every quadratic function can be written in standard form. We begin with , assume , and complete the square in complete generality.
Comparing this last expression with the standard form, we identify with so that . Instead of memorizing the value , we see that . As such, we have derived a vertex formula for the general form. We summarize both vertex formulas in the box at the top of the next page.
There are two more results which can be gleaned from the completed-square form of the general form of a quadratic function,
We have seen that the number in the standard form of a quadratic function determines whether the parabola opens upwards (if ) or downwards (if ). We see here that this number is none other than the coefficient of in the general form of the quadratic function. In other words, it is the coefficient of alone which determines this behavior – a result that is generalized in Section 3.1. The second treasure is a re-discovery of the quadratic formula.
Assuming the conditions of Equation 2.5, the solutions to are precisely the zeros of . Since
the equation is equivalent to
Solving gives
In our discussions of domain, we were warned against having negative numbers underneath the square root. Given that is part of the Quadratic Formula, we will need to pay special attention to the radicand . It turns out that the quantity plays a critical role in determining the nature of the solutions to a quadratic equation. It is given a special name.
The discriminant `discriminates' between the kinds of solutions we get from a quadratic equation. These cases, and their relation to the discriminant, are summarized below.
The proof of Theorem 2.3 stems from the position of the discriminant in the quadratic equation, and is left as a good mental exercise for the reader. The next example exploits the fruits of all of our labor in this section thus far.
Our next example is another classic application of quadratic functions.
We conclude this section with the graph of a more complicated absolute value function.
If we take a step back and look at the graphs of and in the last example, we notice that to obtain the graph of from the graph of , we reflect a portion of the graph of about the -axis. We can see this analytically by substituting into the formula for and calling to mind Theorem 1.4 from Section 1.7.
The function is defined so that when is negative (i.e., when its graph is below the -axis), the graph of is its refection across the -axis. This is a general template to graph functions of the form . From this perspective, the graph of can be obtained by reflecting the portion of the line which is below the -axis back above the -axis creating the characteristic `' shape.
Exercises
In Exercises -, graph the quadratic function. Find the - and -intercepts of each graph, if any exist. If it is given in general form, convert it into standard form; if it is given in standard form, convert it into general form. Find the domain and range of the function and list the intervals on which the function is increasing or decreasing. Identify the vertex and the axis of symmetry and determine whether the vertex yields a relative and absolute maximum or minimum.
In Exercises -, the cost and price-demand functions are given for different scenarios. For each scenario,
Find the profit function .
Find the number of items which need to be sold in order to maximize profit.
Find the maximum profit.
Find the price to charge per item in order to maximize profit.
Find and interpret break-even points.
The cost, in dollars, to produce “I'd rather be a Sasquatch” T-Shirts is , and the price-demand function, in dollars per shirt, is , .
The cost, in dollars, to produce bottles of All-Natural Certified Free-Trade Organic Sasquatch Tonic is , and the price-demand function, in dollars per bottle, is , .
The cost, in cents, to produce cups of Mountain Thunder Lemonade at Junior's Lemonade Stand is , and the price-demand function, in cents per cup, is , .
The daily cost, in dollars, to produce Sasquatch Berry Pies is , and the price-demand function, in dollars per pie, is , .
The monthly cost, in hundreds of dollars, to produce custom built electric scooters is , and the price-demand function, in hundreds of dollars per scooter, is , .
The International Silver Strings Submarine Band holds a bake sale each year to fund their trip to the National Sasquatch Convention. It has been determined that the cost in dollars of baking cookies is and that the demand function for their cookies is How many cookies should they bake in order to maximize their profit?
Using data from Bureau of Transportation Statistics, the average fuel economy in miles per gallon for passenger cars in the US can be modeled by , , where is the number of years since . Find and interpret the coordinates of the vertex of the graph of .
The temperature , in degrees Fahrenheit, hours after 6 AM is given by:
What is the warmest temperature of the day? When does this happen?
Suppose represents the costs, in hundreds, to produce
thousand pens. How many pens should be produced to minimize the cost? What is this minimum cost?
Skippy wishes to plant a vegetable garden along one side of his house. In his garage, he found 32 linear feet of fencing. Since one side of the garden will border the house, Skippy doesn't need fencing along that side. What are the dimensions of the garden which will maximize the area of the garden? What is the maximum area of the garden?
In the situation of Example 2.3.4, Donnie has a nightmare that one of his alpaca herd fell into the river and drowned. To avoid this, he wants to move his rectangular pasture away from the river. This means that all four sides of the pasture require fencing. If the total amount of fencing available is still 200 linear feet, what dimensions maximize the area of the pasture now? What is the maximum area? Assuming an average alpaca requires 25 square feet of pasture, how many alpaca can he raise now?
What is the largest rectangular area one can enclose with 14 inches of string?
The height of an object dropped from the roof of an eight story building is modeled by , . Here, is the height of the object off the ground, in feet, seconds after the object is dropped. How long before the object hits the ground?
The height in feet of a model rocket above the ground seconds after lift-off is given by , for . When does the rocket reach its maximum height above the ground? What is its maximum height?
Carl's friend Jason participates in the Highland Games. In one event, the hammer throw, the height in feet of the hammer above the ground seconds after Jason lets it go is modeled by . What is the hammer's maximum height? What is the hammer's total time in the air? Round your answers to two decimal places.
Assuming no air resistance or forces other than the Earth's gravity, the height above the ground at time of a falling object is given by where is in meters, is in seconds, is the object's initial velocity in meters per second and is its initial position in meters.
What is the applied domain of this function?
Discuss with your classmates what each of and would mean.
Come up with a scenario in which .
Let's say a slingshot is used to shoot a marble straight up from the ground with an initial velocity of 15 meters per second. What is the marble's maximum height above the ground? At what time will it hit the ground?
Now shoot the marble from the top of a tower which is 25 meters tall. When does it hit the ground?
What would the height function be if instead of shooting the marble up off of the tower, you were to shoot it straight DOWN from the top of the tower?
The two towers of a suspension bridge are 400 feet apart. The parabolic cable11 attached to the tops of the towers is 10 feet above the point on the bridge deck that is midway between the towers. If the towers are 100 feet tall, find the height of the cable directly above a point of the bridge deck that is 50 feet to the right of the left-hand tower.
Graph
Find all of the points on the line which are units from .
Let be the line . Find a function which measures the distance squared from a point on to . Use this to find the point on closest to .
With the help of your classmates, show that if a quadratic function has two real zeros then the -coordinate of the vertex is the midpoint of the zeros.
In Exercises -, solve the quadratic equation for the indicated variable.
for
for
for
for
for
for (Assume .)
Answers
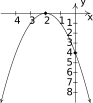
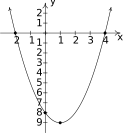
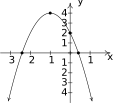
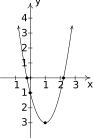
(this is both forms!) No -intercepts -intercept Domain: Range: Decreasing on Increasing on Vertex is a minimum Axis of symmetry
Figure 2.67
-intercept
-intercept Domain: Range: Increasing on Decreasing on Vertex is a maximum Axis of symmetry
Figure 2.68
-intercepts and
-intercept Domain: Range: Decreasing on Increasing on Vertex is a minimum Axis of symmetry
Figure 2.69
-intercepts and
-intercept Domain: Range: Increasing on Decreasing on Vertex is a maximum Axis of symmetry
Figure 2.70
-intercepts and
-intercept Domain: Range: Increasing on Decreasing on Vertex is a minimum Axis of symmetry
Figure 2.71
No -intercepts -intercept Domain: Range: Increasing on Decreasing on Vertex is a maximum Axis of symmetry
Figure 2.72
No -intercepts -intercept Domain: Range: Increasing on Decreasing on Vertex is a minimum Axis of symmetry
Figure 2.73
-intercepts and
-intercept Domain: Range: Increasing on Decreasing on Vertex is a maximum Axis of symmetry
Figure 2.74
-intercepts and
-intercept Domain: Range: Decreasing on Increasing on Vertex is a minimum12 Axis of symmetry
Figure 2.75
, for .
T-shirts should be made and sold to maximize profit.
The maximum profit is .
The price per T-shirt should be set at to maximize profit.
The break even points are and , so to make a profit, between 1 and 13 T-shirts need to be made and sold.
, for
Since the vertex occurs at , and it is impossible to make or sell bottles of tonic, maximum profit occurs when either or bottles of tonic are made and sold.
The maximum profit is .
The price per bottle can be either (to sell 12 bottles) or (to sell 13 bottles.) Both will result in the maximum profit.
The break even points are and , so to make a profit, between 5 and 20 bottles of tonic need to be made and sold.
, for
cups of lemonade need to be made and sold to maximize profit.
The maximum profit is ¢ or .
The price per cup should be set at ¢ per cup to maximize profit.
The break even points are and , so to make a profit, between 4 and 20 cups of lemonade need to be made and sold.
, for
pies should be made and sold to maximize the daily profit.
The maximum daily profit is .
The price per pie should be set at to maximize profit.
The break even points are and , so to make a profit, between 6 and 12 pies need to be made and sold daily.
, for
scooters need to be made and sold to maximize profit.
The maximum monthly profit is hundred dollars, or .
The price per scooter should be set at hundred dollars, or per scooter.
The break even points are and , so to make a profit, between 10 and 50 scooters need to be made and sold monthly.
495 cookies
The vertex is (approximately) , which corresponds to a maximum fuel economy of 22.66 miles per gallon, reached sometime between 2009 and 2010 (29 – 30 years after 1980.) Unfortunately, the model is only valid up until 2008 (28 years after 1908.) So, at this point, we are using the model to predict the maximum fuel economy.
at 2 PM (8 hours after 6 AM.)
5000 pens should be produced for a cost of .
8 feet by 16 feet; maximum area is 128 square feet.
50 feet by 50 feet; maximum area is 2500 feet; he can raise 100 average alpacas.
The largest rectangle has area square inches.
seconds.
The rocket reaches its maximum height of feet seconds after lift-off.
The hammer reaches a maximum height of approximately feet. The hammer is in the air approximately seconds.
The applied domain is .
The height function is this case is . The vertex of this parabola is approximately so the maximum height reached by the marble is meters. It hits the ground again when seconds.
The revised height function is which has zeros at and . We ignore the negative value and claim that the marble will hit the ground after seconds.
Shooting down means the initial velocity is negative so the height functions becomes .
Make the vertex of the parabola so that the point on the top of the left-hand tower where the cable connects is and the point on the top of the right-hand tower is . Then the parabola is given by . Standing feet to the right of the left-hand tower means you're standing at and . So the cable is 60.625 feet above the bridge deck there.
Figure 2.76
,
, is minimized when , so the point on closest to is
Adapted from Precalculus, 3rd corrected edition, by Carl Stitz and Jeff Zeager (stitz-zeager.com), licensed under CC BY-NC-SA 3.0. Changes were made: reformatted as an accessible XYZ web edition. License: CC-BY-NC-SA-3.0.
These eBooks are a prerelease and are not yet certified conformant with WCAG 2.1 AA or ADA Title II. Every page is built against an automated accessibility gate, and the published editions will meet ADA Title II requirements when they release in late September 2026. If something is unusable, please tell us.