
2.1 Linear Functions
We now begin the study of families of functions. Our first family, linear functions, are old friends as we shall soon see. Recall from Geometry that two distinct points in the plane determine a unique line containing those points, as indicated below.

To give a sense of the `steepness' of the line, we recall that we can compute the slope of the line using the formula below.
A couple of notes about Equation 2.1 are in order. First, don't ask why we use the letter `' to represent slope. There are many explanations out there, but apparently no one really knows for sure.1 Secondly, the stipulation ensures that we aren't trying to divide by zero. The reader is invited to pause to think about what is happening geometrically; the anxious reader can skip along to the next example.
A few comments about Example 2.1.1 are in order. First, for reasons which will be made clear soon, if the slope is positive then the resulting line is said to be increasing. If it is negative, we say the line is decreasing. A slope of results in a horizontal line which we say is constant, and an undefined slope results in a vertical line.2 Second, the larger the slope is in absolute value, the steeper the line. You may recall from Intermediate Algebra that slope can be described as the ratio `'. For example, in the second part of Example 2.1.1, we found the slope to be . We can interpret this as a rise of 1 unit upward for every units to the right we travel along the line, as shown below.
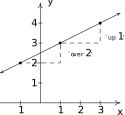
Using more formal notation, given points and , we use the Greek letter delta `' to write and . In most scientific circles, the symbol means `change in'.
Hence, we may write
which describes the slope as the rate of change of with respect to . Rates of change abound in the `real world', as the next example illustrates.
Now it may well happen that in the previous scenario, at noon the temperature is only F. This doesn't mean our calculations are incorrect, rather, it means that the temperature change throughout the day isn't a constant F per hour. As discussed in Section 1.4.1, mathematical models are just that: models. The predictions we get out of the models may be mathematically accurate, but may not resemble what happens in the real world.
In Section 1.2, we discussed the equations of vertical and horizontal lines. Using the concept of slope, we can develop equations for the other varieties of lines. Suppose a line has a slope of and contains the point . Suppose is another point on the line, as indicated below.
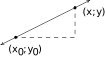
Equation 2.1 yields
We have just derived the point-slope form of a line.3
In simplifying the equation of the line in the previous example, we produced another form of a line, the slope-intercept form. This is the familiar form you have probably seen in Intermediate Algebra. The `intercept' in `slope-intercept' comes from the fact that if we set , we get . In other words, the -intercept of the line is .
Note that if we have slope , we get the equation which matches our formula for a horizontal line given in Section 1.2. The formula given in Equation 2.3 can be used to describe all lines except vertical lines. All lines except vertical lines are functions (Why is this?) so we have finally reached a good point to introduce linear functions.
For the case , we get . These are given their own classification.
Recall that to graph a function, , we graph the equation . Hence, the graph of a linear function is a line with slope and -intercept ; the graph of a constant function is a horizontal line (a line with slope ) and a -intercept of . Now think back to Section 1.6.1, specifically Definition 1.10 concerning increasing, decreasing and constant functions. A line with positive slope was called an increasing line because a linear function with is an increasing function. Similarly, a line with a negative slope was called a decreasing line because a linear function with is a decreasing function. And horizontal lines were called constant because, well, we hope you've already made the connection.
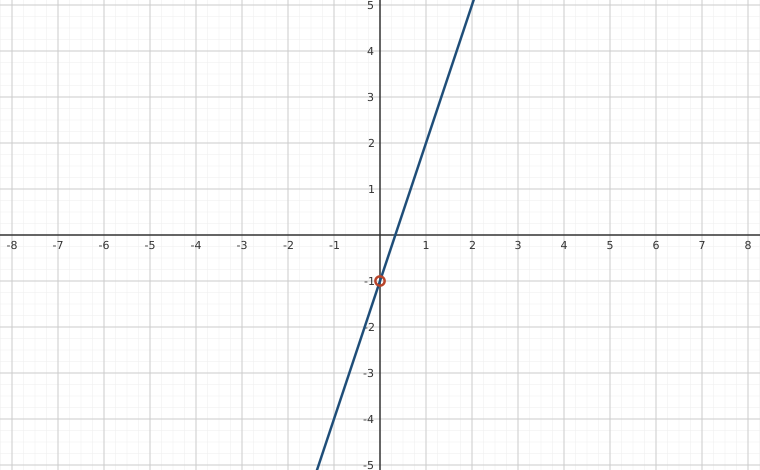
The last two functions in the previous example showcase some of the difficulty in defining a linear function using the phrase `of the form' as in Definition 2.1, since some algebraic manipulations may be needed to rewrite a given function to match `the form'. Keep in mind that the domains of linear and constant functions are all real numbers , so while simplified to a formula , is not considered a linear function since its domain excludes . However, we would consider
to be a constant function since its domain is all real numbers (Can you tell us why?) and
The following example uses linear functions to model some basic economic relationships.
The next example asks us to find a linear function to model a related economic problem.
Not all real-world phenomena can be modeled using linear functions. Nevertheless, it is possible to use the concept of slope to help analyze non-linear functions using the following.
Geometrically, if we have the graph of , the average rate of change over is the slope of the line which connects and . This is called the secant line through these points. For that reason, some textbooks use the notation for the average rate of change of a function. Note that for a linear function , or in other words, its rate of change over an interval is the same as its average rate of change.
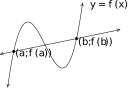
The graph of and its secant line through and
The interested reader may question the adjective `average' in the phrase `average rate of change'. In the figure above, we can see that the function changes wildly on , yet the slope of the secant line only captures a snapshot of the action at and . This situation is entirely analogous to the average speed on a trip. Suppose it takes you hours to travel miles. Your average speed is . However, it is entirely possible that at the start of your journey, you traveled miles per hour, then sped up to miles per hour, and so forth. The average rate of change is akin to your average speed on the trip. Your speedometer measures your speed at any one instant along the trip, your instantaneous rate of change, and this is one of the central themes of Calculus.6
When interpreting rates of change, we interpret them the same way we did slopes. In the context of functions, it may be helpful to think of the average rate of change as:
We close this section with a new look at difference quotients which were first introduced in Section 1.4. If we wish to compute the average rate of change of a function over the interval , then we would have
As we have indicated, the rate of change of a function (average or otherwise) is of great importance in Calculus.7 Also, we have the geometric interpretation of difference quotients which was promised to you back on page the related section – a difference quotient yields the slope of a secant line.
Exercises
In Exercises -, find both the point-slope form and the slope-intercept form of the line with the given slope which passes through the given point.
In Exercises -, find the slope-intercept form of the line which passes through the given points.
In Exercises -, graph the function. Find the slope, -intercept and -intercept, if any exist.
- Find all of the points on the line which are units from the point .
- Jeff can walk comfortably at miles per hour. Find a linear function that represents the total distance Jeff can walk in hours, assuming he doesn't take any breaks.
- Carl can stuff envelopes per minute. Find a linear function that represents the total number of envelopes Carl can stuff after hours, assuming he doesn't take any breaks.
- A landscaping company charges per cubic yard of mulch plus a delivery charge of . Find a linear function which computes the total cost (in dollars) to deliver cubic yards of mulch.
- A plumber charges for a service call plus per hour. If she spends no longer than 8 hours a day at any one site, find a linear function that represents her total daily charges (in dollars) as a function of time (in hours) spent at any one given location.
- A salesperson is paid $200 per week plus 5% commission on her weekly sales of dollars. Find a linear function that represents her total weekly pay, (in dollars) in terms of . What must her weekly sales be in order for her to earn $475.00 for the week?
- An on-demand publisher charges to print a 600 page book and to print a 400 page book. Find a linear function which models the cost of a book as a function of the number of pages . Interpret the slope of the linear function and find and interpret .
- The Topology Taxi Company charges for the first fifth of a mile and for each additional fifth of a mile. Find a linear function which models the taxi fare as a function of the number of miles driven, . Interpret the slope of the linear function and find and interpret .
Water freezes at Celsius and Fahrenheit and it boils at C and F.
- Find a linear function that expresses temperature in the Fahrenheit scale in terms of degrees Celsius. Use this function to convert C into Fahrenheit.
- Find a linear function that expresses temperature in the Celsius scale in terms of degrees Fahrenheit. Use this function to convert F into Celsius.
- Is there a temperature such that ?
- Legend has it that a bull Sasquatch in rut will howl approximately 9 times per hour when it is outside and only 5 times per hour if it's . Assuming that the number of howls per hour, , can be represented by a linear function of temperature Fahrenheit, find the number of howls per hour he'll make when it's only outside. What is the applied domain of this function? Why?
- Economic forces beyond anyone's control have changed the cost function for PortaBoys to . Rework Example 2.1.5 with this new cost function.
- In response to the economic forces in Exercise above, the local retailer sets the selling price of a PortaBoy at $250. Remarkably, 30 units were sold each week. When the systems went on sale for $220, 40 units per week were sold. Rework Examples 2.1.6 and 2.1.7 with this new data. What difficulties do you encounter?
- A local pizza store offers medium two-topping pizzas delivered for per pizza plus a delivery charge per order. On weekends, the store runs a `game day' special: if six or more medium two-topping pizzas are ordered, they are each with no delivery charge. Write a piecewise-defined linear function which calculates the cost (in dollars) of medium two-topping pizzas delivered during a weekend.
- A restaurant offers a buffet which costs per person. For parties of or more people, a group discount applies, and the cost is per person. Write a piecewise-defined linear function which calculates the total bill of a party of people who all choose the buffet.
A mobile plan charges a base monthly rate of for the first minutes of air time plus a charge of ¢ for each additional minute. Write a piecewise-defined linear function which calculates the monthly cost (in dollars) for using minutes of air time.
HINT: You may want to revisit Exercise in Section 1.4
- The local pet shop charges ¢ per cricket up to 100 crickets, and ¢ per cricket thereafter. Write a piecewise-defined linear function which calculates the price , in dollars, of purchasing crickets.
The cross-section of a swimming pool is below. Write a piecewise-defined linear function which describes the depth of the pool, (in feet) as a function of:
- the distance (in feet) from the edge of the shallow end of the pool, .
- the distance (in feet) from the edge of the deep end of the pool, .
- Graph each of the functions in (a) and (b). Discuss with your classmates how to transform one into the other and how they relate to the diagram of the pool.
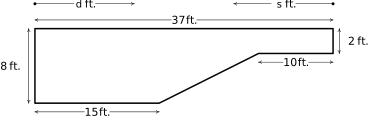
Figure 2.15
In Exercises -, compute the average rate of change of the function over the specified interval.
In Exercises -, compute the average rate of change of the given function over the interval . Here we assume is in the domain of the function.
- The height of an object dropped from the roof of an eight story building is modeled by: , . Here, is the height of the object off the ground in feet, seconds after the object is dropped. Find and interpret the average rate of change of over the interval .
- Using data from Bureau of Transportation Statistics , the average fuel economy in miles per gallon for passenger cars in the US can be modeled by , , where is the number of years since . Find and interpret the average rate of change of over the interval .
The temperature in degrees Fahrenheit hours after 6 AM is given by:
- Find and interpret , and .
- Find and interpret the average rate of change of over the interval .
- Find and interpret the average rate of change of from to .
- Find and interpret the average rate of temperature change between 10 AM and 6 PM.
- Suppose represents the costs, in hundreds, to produce thousand pens. Find and interpret the average rate of change as production is increased from making 3000 to 5000 pens.
- With the help of your classmates find several other “real-world” examples of rates of change that are used to describe non-linear phenomena.
(Parallel Lines) Recall from Intermediate Algebra that parallel lines have the same slope. (Please note that two vertical lines are also parallel to one another even though they have an undefined slope.) In Exercises -, you are given a line and a point which is not on that line. Find the line parallel to the given line which passes through the given point.
(Perpendicular Lines) Recall from Intermediate Algebra that two non-vertical lines are perpendicular if and only if they have negative reciprocal slopes. That is to say, if one line has slope and the other has slope then . (You will be guided through a proof of this result in Exercise.) Please note that a horizontal line is perpendicular to a vertical line and vice versa, so we assume and . In Exercises -, you are given a line and a point which is not on that line. Find the line perpendicular to the given line which passes through the given point.
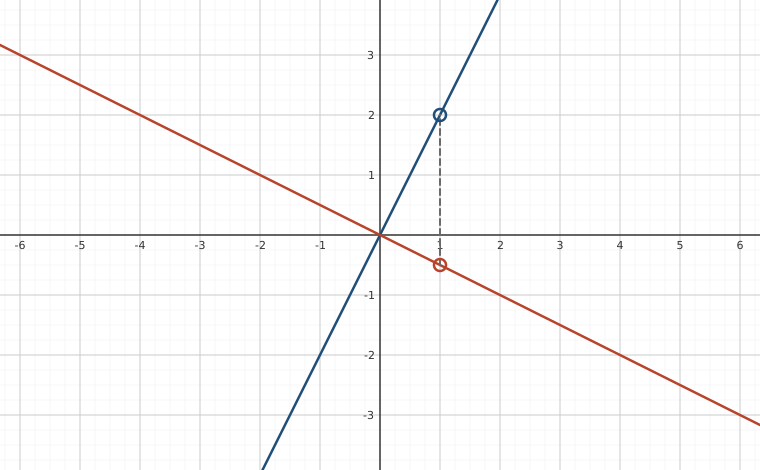
We shall now prove that is perpendicular to if and only if . To make our lives easier we shall assume that and . We can also “move” the lines so that their point of intersection is the origin without messing things up, so we'll assume (Take a moment with your classmates to discuss why this is okay.) Graphing the lines and plotting the points , and gives us the following set up.
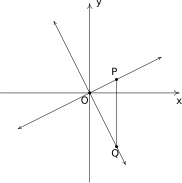
Figure 2.16 The line will be perpendicular to the line if and only if is a right triangle. Let be the distance from to , let be the distance from to and let be the distance from to . Use the Pythagorean Theorem to show that is a right triangle if and only if by showing if and only if .
- Show that if , the line containing the points and is perpendicular to the line . (Coupled with the result from Example 1.1.7 on page, we have now shown that the line is a perpendicular bisector of the line segment connecting and . This means the points and are symmetric about the line . We will revisit this symmetry in section 5.2.)
The function defined by is called the Identity Function.
- Discuss with your classmates why this name makes sense.
- Show that the point-slope form of a line (Equation 2.2) can be obtained from using a sequence of the transformations defined in Section 1.7.
Answers
slope:
-intercept:
-intercept:
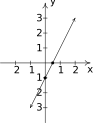
Figure 2.17 slope:
-intercept:
-intercept:
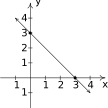
Figure 2.18 slope:
-intercept:
-intercept: none

Figure 2.19 slope:
-intercept:
-intercept:

Figure 2.20 slope:
-intercept:
-intercept:

Figure 2.21 slope:
-intercept:
-intercept:

Figure 2.22 - and
- , .
- , .
- , .
- , .
- She must make $5500 in weekly sales.
- The slope means it costs ¢ per page. means there is a fixed, or start-up, cost of to make each book.
- The slope means it costs an additional for each mile beyond the first 0.2 miles. , so according to the model, it would cost for a trip of miles. Would this ever really happen? Depends on the driver and the passenger, we suppose.
- .
and howls per hour.
Having a negative number of howls makes no sense and since we can put an upper bound of on the domain. The lower bound is trickier because there's nothing other than common sense to go on. As it gets colder, he howls more often. At some point it will either be so cold that he freezes to death or he's howling non-stop. So we're going to say that he can withstand temperatures no lower than so that the applied domain is .
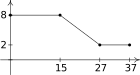
Figure 2.23 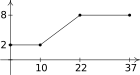
Figure 2.24
- The average rate of change is . During the first two seconds after it is dropped, the object has fallen at an average rate of feet per second. (This is called the average velocity of the object.)
- The average rate of change is . During the years from 1980 to 2008, the average fuel economy of passenger cars in the US increased, on average, at a rate of miles per gallon per year.
- , so at 10 AM (4 hours after 6 AM), it is F. , so at 2 PM (8 hours after 6 AM), it is F. , so at 6 PM (12 hours after 6 AM), it is F.
- The average rate of change is . Between 10 AM and 2 PM, the temperature increases, on average, at a rate of F per hour.
- The average rate of change is . Between 2 PM and 6 PM, the temperature decreases, on average, at a rate of F per hour.
- The average rate of change is . Between 10 AM and 6 PM, the temperature, on average, remains constant.
- The average rate of change is . As production is increased from 3000 to 5000 pens, the cost decreases at an average rate of per 1000 pens produced (20¢ per pen.)
Adapted from Precalculus, 3rd corrected edition, by Carl Stitz and Jeff Zeager (stitz-zeager.com), licensed under CC BY-NC-SA 3.0. Changes were made: reformatted as an accessible XYZ web edition. License: CC-BY-NC-SA-3.0.