
5.6 Stem and leaf Plots
We need to install Stemgraphic for plotting stem-and-leaf plot. This is because Stemgraphic is not included in any of the Python Libraries. To install Stemgraphic type the following syntax. Stemgraphic Modules Link
Note: Stemplots (Stem-and-Leaf plots) should only be used for small datasets.
pip install stemgraphicThe output generated by the installation process has been deleted above. It is not important.
After stemgraphic is properly installed use the syntax below to plot a stem-and-leaf plot with dataset saved in x.
import stemgraphic
stemgraphic.stem_graphic(x, scale = 10,aggregation=False)
Note: We need to execute(run) pip install stemgraphic for every new session to graph stem-and-leaf plot.
Example: The dataset below is exam scores. Construct stem-and-leaf plot.
33, 42, 49, 49, 53, 55, 55, 61, 63, 67, 68, 68, 69, 69, 72, 73, 74, 78, 80, 83, 88, 88, 88, 90, 92, 94, 94, 94, 94, 96, 100
- Click
+ Code - Type
pip install stemgraphic - Click
playbutton - Click
+ Code - Type
import stemgraphic - Type
x = [33, 42, 49, 49, 53, 55, 55, 61, 63, 67, 68, 68, 69, 69, 72, 73, 74,78, 80, 83, 88, 88, 88, 90, 92, 94, 94, 94, 94, 96, 100] - Type
stemgraphic.stem_graphic(x,scale=10,aggregation=False) - Click
playbutton
import stemgraphic
x = [33, 42, 49, 49, 53, 55, 55, 61, 63, 67, 68, 68, 69, 69, 72, 73, 74,
           78, 80, 83, 88, 88, 88, 90, 92, 94, 94, 94, 94, 96, 100]
stemgraphic.stem_graphic(x,scale=10,aggregation=False)
Show expected output
(<Figure size 540x198 with 1 Axes>,
 <matplotlib.axes._axes.Axes at 0x7fcbacfd48d0>)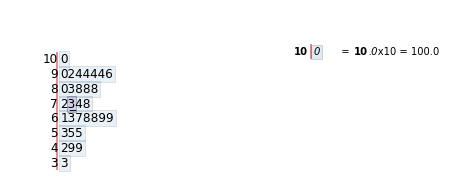
Example: The dataset below is scores of 20 students in a stat class. Construct a stem-and-leaf plot.
[81, 21, 53, 32, 80, 13, 26, 42, 35, 41, 14, 25, 87, 62, 46, 40, 32, 52, 85, 28, 17, 36, 83, 79, 18, 50, 17, 36, 36, 19]
import stemgraphic

x = [81, 21, 53, 32, 80, 13, 26, 42, 35, 41, 14, 25, 87, 62, 46, 40, 32,
       52, 85, 28, 17, 36, 83, 79, 18, 50, 17, 36, 36, 19]

stemgraphic.stem_graphic(x,scale = 10,aggregation=False)
Show expected output
(<Figure size 540x198 with 1 Axes>,
 <matplotlib.axes._axes.Axes at 0x7f9c42819fd0>)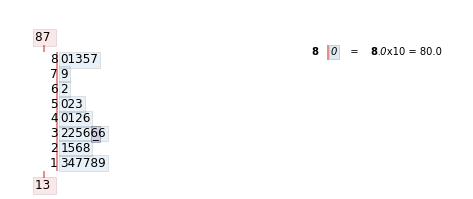
Adapted from Python for Introductory Statistics, by Simon Aman (Truman College, City Colleges of Chicago), licensed under CC BY 4.0. Changes were made: reformatted as an accessible XYZ web edition with live in-browser code cells. License: CC-BY-4.0.