
5.5 Dot Plots
Dot plot is like bar graph with dots instead of bars. To graph an dot plot, use the function dotplot(x) given below. x is the dataset list.
# dotplot by Patrick FitzGerald
def dotplots(x, x_label="Data Values"):
         # takes a x and x_label (by default it is Data Values)

 import numpy as np
 import matplotlib.pyplot as plt

 data = np.array(x)   # convert to array
 values, counts = np.unique(data, return_counts=True)

# dot plot with appropriate figure size and y-axis limits
 fig, ax = plt.subplots(figsize=(6, 2.25))
 for value, count in zip(values, counts):
    ax.plot([value]*count, list(range(count)), 'co', ms=10, linestyle='')
 for spine in ['top', 'right', 'left']:
    ax.spines[spine].set_visible(False)
 ax.yaxis.set_visible(False)
 ax.set_ylim(-1, max(counts))
 ax.set_xticks(range(min(values), max(values)+1))
 ax.tick_params(axis='x', length=0, pad=8, labelsize=12)

 plt.suptitle("Dot Plot")
 plt.ylabel("frequency")
 plt.xlabel(x_label)

 return plt.show()
Example: Use the dotplot(x) function above to plot a dot plot of the dataset given below.
1, 2, 2, 3, 3, 3, 3, 4, 7, 9
- Click
playbutton on the code abovedef dotplot(x) - Type
x = [1,2,2,3,3,3,3,4,7,9] - Type
dotplot(x) - Click
playbutton
x=[1, 2, 2, 3, 3, 3, 3, 4, 7, 9]
dotplots(x)![Dot plot of [1, 2, 2, 3, 3, 3, 3, 4, 7, 9]: a stack of four dots over 3, two over 2, and single dots over 1, 4, 7 and 9.](photos/ch05-img11.png)
Example: The dataset below is the waiting time, in minutes, of customers at a fast food restaurant. Construct a dot plot.
2, 4, 7, 5, 3, 9, 6, 4, 2, 7, 7, 7, 4, 7, 9
First run(execute) the dotplots(x) above.
x = [2, 4, 7, 5, 3, 9, 6, 4, 2, 7, 7, 7, 4, 7, 9]
dotplots(x, "Waiting Time")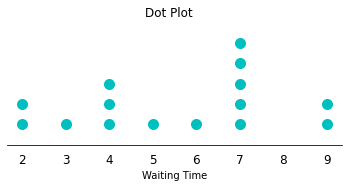
Adapted from Python for Introductory Statistics, by Simon Aman (Truman College, City Colleges of Chicago), licensed under CC BY 4.0. Changes were made: reformatted as an accessible XYZ web edition with live in-browser code cells. License: CC-BY-4.0.