
16.1 Log Transformations
The log transformation can be used to make highly skewed distributions less skewed. This can be valuable both for making patterns in the data more interpretable and for helping to meet the assumptions of inferential statistics.
Figure 1 shows an example of how a log transformation can make patterns more visible. Both graphs plot the brain weight of animals as a function of their body weight. The raw weights are shown in the upper panel; the log-transformed weights are plotted in the lower panel.
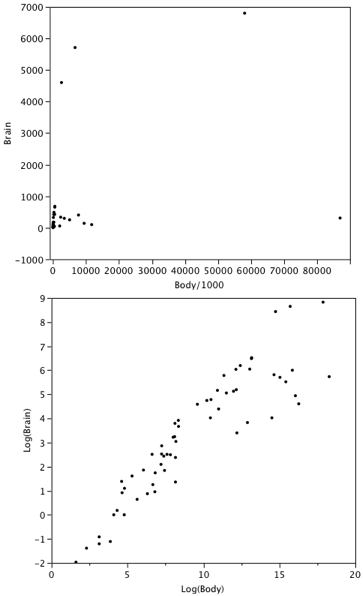
It is hard to discern a pattern in the upper panel whereas the strong relationship is shown clearly in the lower panel.
The comparison of the means of log-transformed data is actually a comparison of geometric means. This occurs because, as shown below, the anti-log of the arithmetic mean of log-transformed values is the geometric mean.
Table 1 shows the logs (base 10) of the numbers 1, 10, and 100. The arithmetic mean of the three logs is
(0 + 1 + 2)/3 = 1.
The anti-log of this arithmetic mean of 1 is
101 = 10
which is the geometric mean:
(1 x 10 x 100).3333 = 10.
Table 1. Logarithms.
| X | Log10(X) |
|---|---|
| 1 10 100 | 0 1 2 |
Therefore, if the arithmetic means of two sets of log-transformed data are equal, then the geometric means are equal.
Adapted from Online Statistics Education: A Multimedia Course of Study (onlinestatbook.com), Project Leader: David M. Lane, Rice University. Developed with NSF support. The original work is in the public domain; it is cited here at the authors' request. Changes were made: reformatted as an accessible XYZ web edition with native MathML. License: Public-Domain.