
7.7 Normal Approximation Demo
This section is an interactive demonstration. The live simulation runs on the original site: open the demonstration at onlinestatbook.com.
Learning Objectives
- State the relationship between sample size and the accuracy of normal approximation of the binomial distribution.
Instructions
The normal distribution can be used to approximate the binomial distribution. This demonstration allows you to explore the accuracy of the approximation under a variety of conditions.
Illustrated Instructions
The demonstration displays the probability of success over a specific number of trials based on the entered total number of trials (N) and the probability of success on a given trial. You can change N as well as p and then select the proportion for which you would like the probability to be calculated.
By clicking the appropriate radio button, you can choose to calculate the probability above a specified value or between two values.
Try out various values of N and p to calculate various approximations to the binomial to explore the accuracy of the approximation.
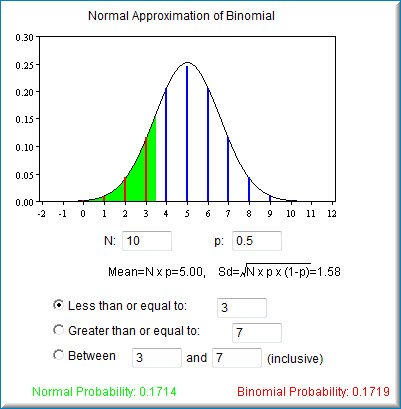
The calculation based on the normal approximation to the binomial is shown in green below and is equal to 0.1714. The actual binomial probability of 0.1719 is shown in red.
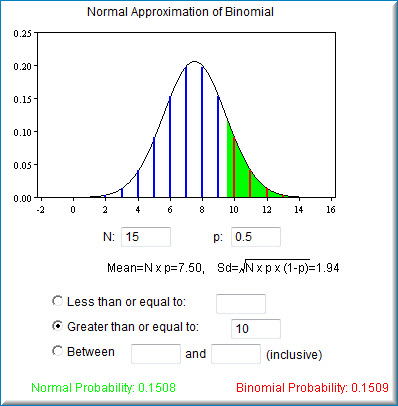
The screenshot below displays results for the probability of greater than 10 successful trials with 15 total trials and a .5 probability of success. The probability based on the normal approximation is displayed at the bottom of the screen in green next to the binomial probability displayed in red.
We recommend you answer the questions even if you have to guess. Then use the simulation to help if necessary.
You can change the the means and standard deviations of both distributions by typing values in the respective fields below.
Adapted from Online Statistics Education: A Multimedia Course of Study (onlinestatbook.com), Project Leader: David M. Lane, Rice University. Developed with NSF support. The original work is in the public domain; it is cited here at the authors' request. Changes were made: reformatted as an accessible XYZ web edition with native MathML. License: Public-Domain.