
7.4 Varieties Demonstration
This section is an interactive demonstration. The live simulation runs on the original site: open the demonstration at onlinestatbook.com.
Learning Objectives
- State the relationship between the mean and standard deviation of a distribution and its shape.
- Be able to describe differences in distributions based on their shape and statistics.
Instructions
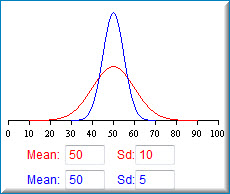
This demonstration allows you to change the mean and standard deviation of two normal distributions and observe the effects on the shapes of the distributions.When the demonstration begins, the red distribution has a mean of 50 and a standard deviaton of 10. The blue distribution has a mean of 50 and a standard deviation of 5. Notice how much more spread out the red distribution is than the blue distribution.
Choose different values for the two distributions and investigate their effects.
Illustrated Instructions
The demonstration starts by displaying two curves both with a mean of 50 and with standard deviations of 10 and 5 respectively. You can change the values for the mean and standard deviation for both curves.
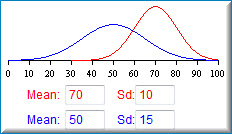
The screenshot below shows the distributions with different means and standard deviations. Note that the curves are on an axis that ranges from 0 - 100, keep this in mind when changing the values of the mean and standard deviations as some values will not be displayed correctly.
We recommend you answer the questions even if you have to guess. Then use the simulation to help you if necessary.
You can change the the means and standard deviations of both distributions by typing values in the respective fields below.
Adapted from Online Statistics Education: A Multimedia Course of Study (onlinestatbook.com), Project Leader: David M. Lane, Rice University. Developed with NSF support. The original work is in the public domain; it is cited here at the authors' request. Changes were made: reformatted as an accessible XYZ web edition with native MathML. License: Public-Domain.