
7.5 Standard Normal
As discussed in the introductory section, normal distributions do not necessarily have the same means and standard deviations. A normal distribution with a mean of 0 and a standard deviation of 1 is called a standard normal distribution.
Areas of the normal distribution are often represented by tables of the standard normal distribution. A portion of a table of the standard normal distribution is shown in Table 1.
Table 1. A portion of a table of the standard normal distribution.
| Z | Area below |
|---|---|
| -2.5 | 0.0062 |
| -2.49 | 0.0064 |
| -2.48 | 0.0066 |
| -2.47 | 0.0068 |
| -2.46 | 0.0069 |
| -2.45 | 0.0071 |
| -2.44 | 0.0073 |
| -2.43 | 0.0075 |
| -2.42 | 0.0078 |
| -2.41 | 0.008 |
| -2.4 | 0.0082 |
| -2.39 | 0.0084 |
| -2.38 | 0.0087 |
| -2.37 | 0.0089 |
| -2.36 | 0.0091 |
| -2.35 | 0.0094 |
| -2.34 | 0.0096 |
| -2.33 | 0.0099 |
| -2.32 | 0.0102 |
The first column titled "Z" contains values of the standard normal distribution; the second column contains the area below Z. Since the distribution has a mean of 0 and a standard deviation of 1, the Z column is equal to the number of standard deviations below (or above) the mean. For example, a Z of -2.5 represents a value 2.5 standard deviations below the mean. The area below Z is 0.0062.
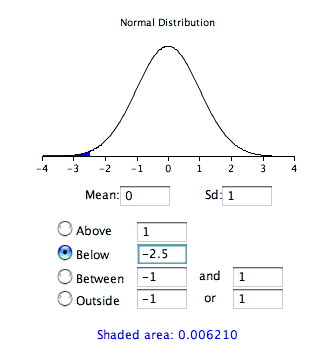
The same information can be obtained using the following Java applet. Figure 1 shows how it can be used to compute the area below a value of -2.5 on the standard normal distribution. Note that the mean is set to 0 and the standard deviation is set to 1.
Calculate Areas
A value from any normal distribution can be transformed into its corresponding value on a standard normal distribution using the following formula:
Z = (X - μ)/σ
where Z is the value on the standard normal distribution, X is the value on the original distribution, μ is the mean of the original distribution, and σ is the standard deviation of the original distribution.
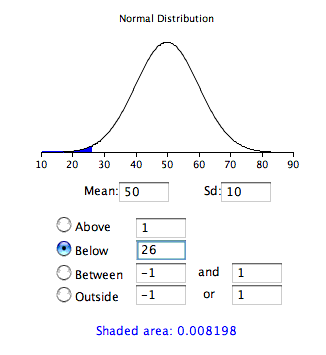
As a simple application, what portion of a normal distribution with a mean of 50 and a standard deviation of 10 is below 26? Applying the formula, we obtain
Z = (26 - 50)/10 = -2.4.
From Table 1, we can see that 0.0082 of the distribution is below -2.4. There is no need to transform to Z if you use the applet as shown in Figure 2.
If all the values in a distribution are transformed to Z scores, then the distribution will have a mean of 0 and a standard deviation of 1. This process of transforming a distribution to one with a mean of 0 and a standard deviation of 1 is called standardizing the distribution.
Adapted from Online Statistics Education: A Multimedia Course of Study (onlinestatbook.com), Project Leader: David M. Lane, Rice University. Developed with NSF support. The original work is in the public domain; it is cited here at the authors' request. Changes were made: reformatted as an accessible XYZ web edition with native MathML. License: Public-Domain.