
4.8 Statistical Literacy
Age and Sleep
The graph below showing the relationship between age and sleep is based on a graph that appears on this web page.
What do you think?
Why might Pearson's correlation not be a good way to describe the relationship?
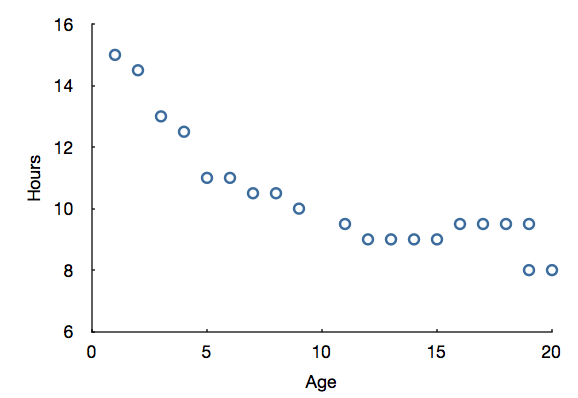
Pearson's correlation measures the strength of the
linear relationship
between two variables. The relationship here is not linear. As age increases, hours slept decreases rapidly at first but then levels off.
Adapted from Online Statistics Education: A Multimedia Course of Study (onlinestatbook.com), Project Leader: David M. Lane, Rice University. Developed with NSF support. The original work is in the public domain; it is cited here at the authors' request. Changes were made: reformatted as an accessible XYZ web edition with native MathML. License: Public-Domain.